
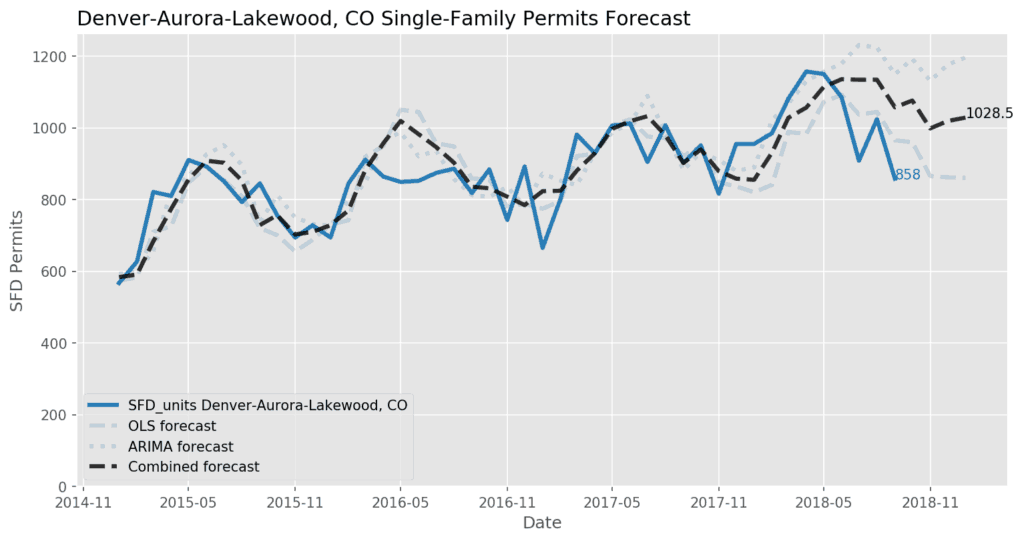
Denver single-family permits are trending down, totaling 1,024 in August and 858 in September.
Denver-Aurora-Lakewood, CO – Economic Data
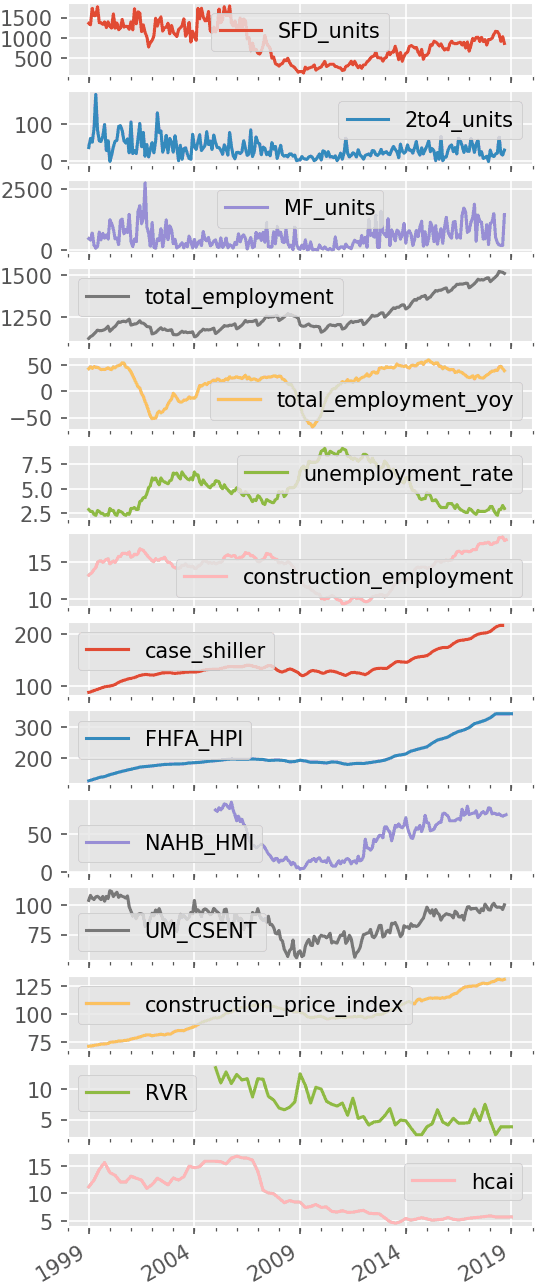
Not familiar with some of the terms above? Jump down to our economic data definitions.
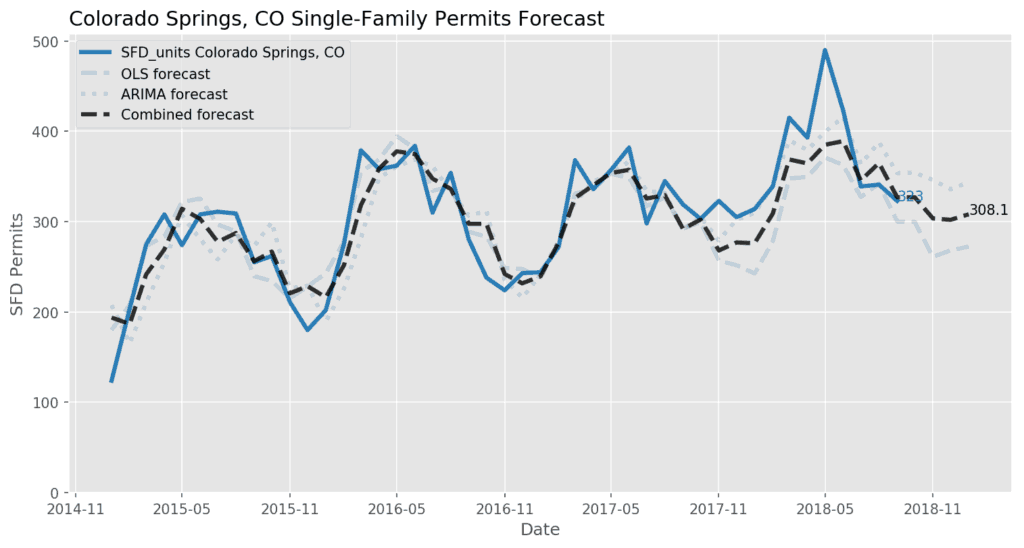
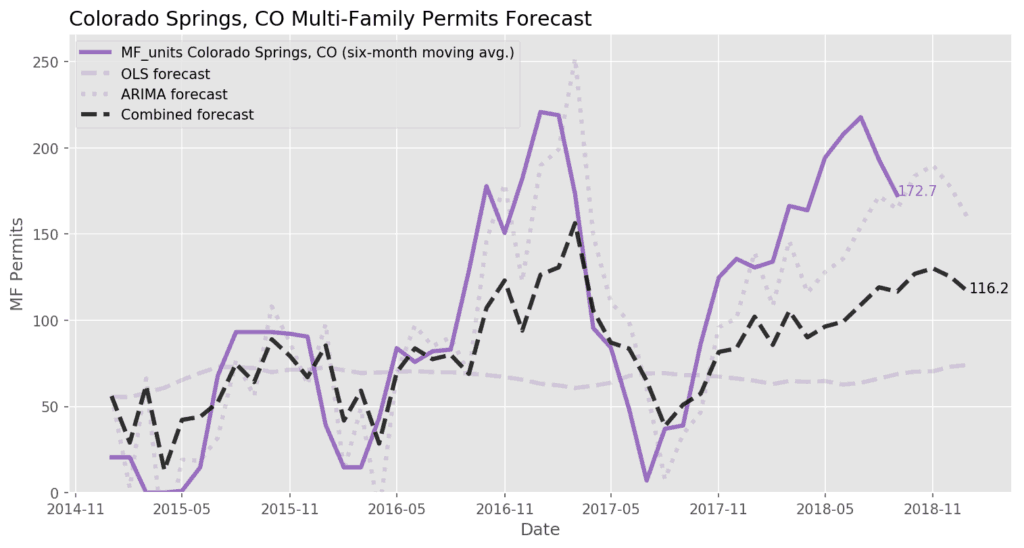
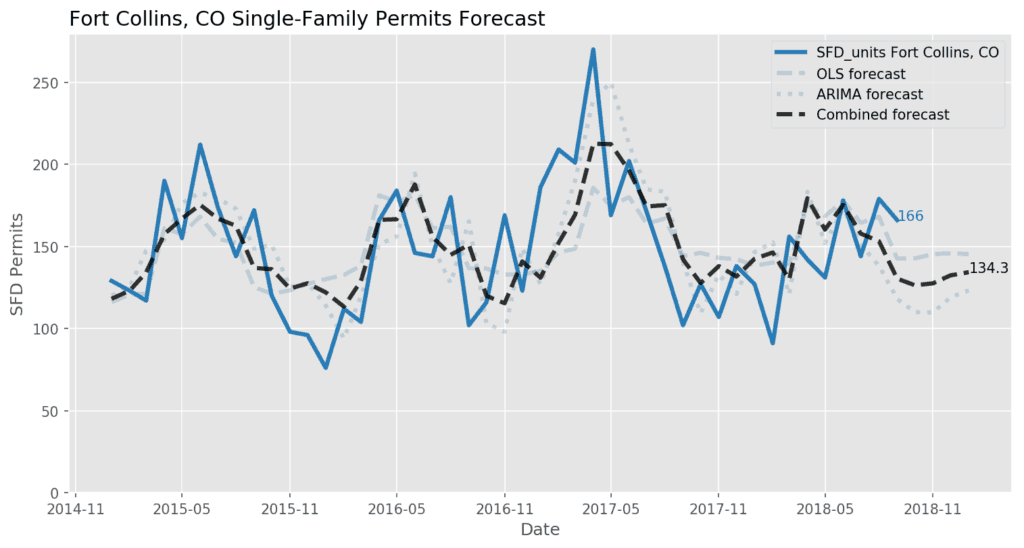
November’s Colorado Housing Market Forecast includes economic indicators, as well as single-family, and multi-family permits for metro Denver, Colorado Springs, and Northern Colorado markets.
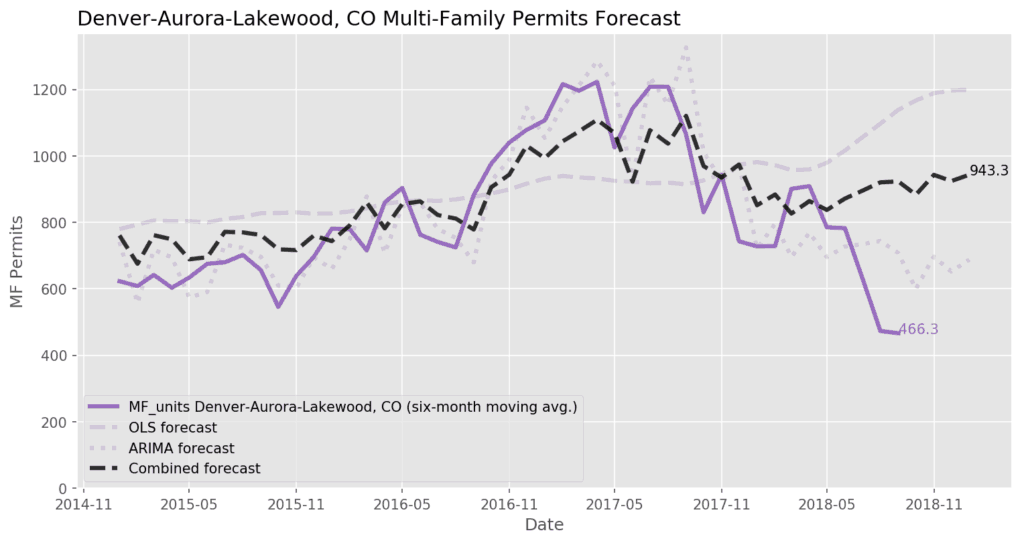
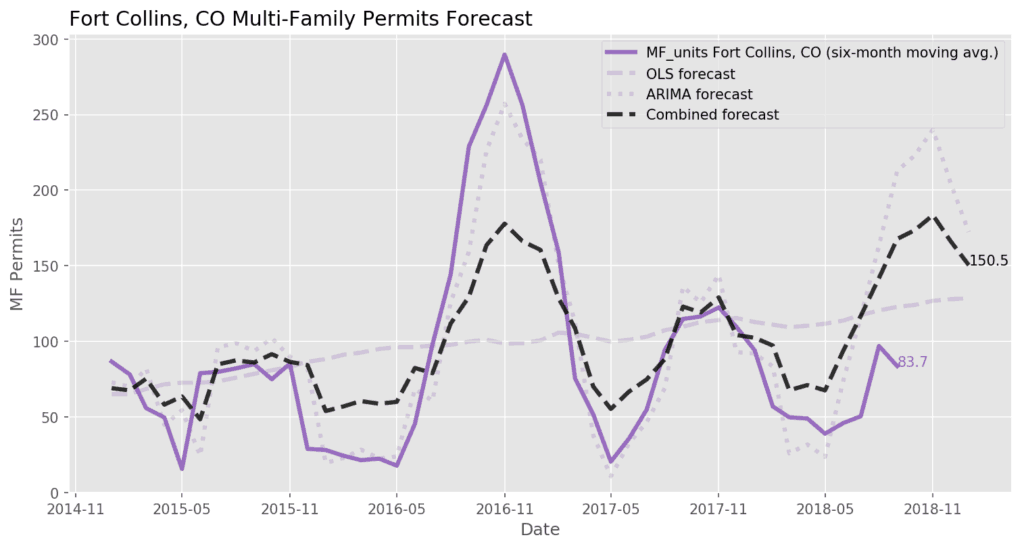
Denver single-family permits are trending down, totaling 1,024 in August and 858 in September. However, despite underperforming the forecast, the decline appears to be seasonal, with the permit totals little changed from one year ago (1,007 in 08-2017 and 902 in 09-2017). On the other hand, multi-family permits have plummeted in the second half of 2018, and with 180 permits approved in August and 1,440 in September, the six-month average fell to a rate of just 466 per month. Denver multi-family units were being approved at a rate of over 1,000 permits per month at this time last year.
Sounding like a broken record at this point, the median sales price for Denver housing continues to outpace wage growth. Redfin reported that half of Denver homes sold in September went for more than $396k, up 6.2% from a year ago. My biggest concern moving forward is buyer exhaustion, as rising interest rates continue to stretch buyers’ budgets, with Zillow reporting that the typical new mortgage payment increased by 15.4% in the last year. (1) A former Chair of the Federal Reserve once joked that the Fed’s job is “to take away the punch bowl just as the party gets going.”(2) It’s debated whether tariffs are deflationary (due to a slowdown in economic activity) or inflationary (due to higher prices for both producers and consumers), but on balance this month’s robust jobs report with 250k jobs added and wage growth of 3.1% makes it likely that the Fed will continue tightening in the near future, with the central bank slated to increase the benchmark federal funds rate for a fourth time this year in December.(3)
Moreover, we can expect that interest rates will continue to see upwards pressure with the Fed accelerating its pace of balance sheet normalization. In short, to stabilize financial markets the Fed bought up troubled assets such as U.S. Treasuries and mortgage-backed securities (MBS) in the wake of the financial crisis, and consequently, the Fed’s balance sheet ballooned from under $1T in 2007 to over $4.5T in 2014. In the last year, the Fed has begun to allow maturing assets to roll off the balance sheet instead of reinvesting the proceeds.(4) The pace of this process will accelerate each quarter. As such, a large buyer of Treasuries and MBS has left the market while, simultaneously, the increased 2018 Federal budget deficit must be funded via greater sales of Treasuries. Higher supply and reduced demand for Treasuries will pressure the price of those bonds, causing rates to continue increasing into 2019.
Poor housing affordability may be starting to suppress sales in the Denver housing market, with the number of homes listed for sale at its highest level since fall 2015. Available inventory would provide for 1.9 months of supply at the current sales pace, which is the highest measure since early 2016. However, with 1.9 months of supply, this is still solidly a home sellers’ market and Denver remains one of the tightest major housing markets in the nation. It will be important to continue monitoring supply and pricing trends in the coming months to determine just how much higher interest rates and home prices are affecting the market.
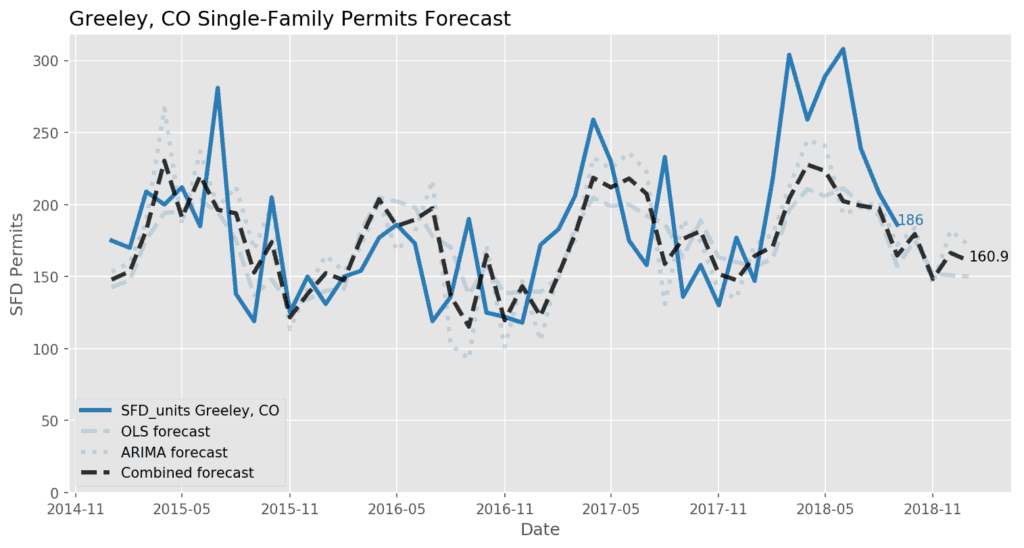
Still, there are reasons to remain optimistic. Denver employment growth has stayed strong, with the metro area adding 39k jobs in the last year versus just 20k new housing units permitted. Denver unemployment, while creeping upwards, remains very low, and national measures of consumer confidence are at their highest levels in 15 years or more. There’s clearly still strong local demand for housing, but the question is whether buyers can stomach ever-higher prices — and whether, if prices do fall with rising interest rates, builders can rein in construction costs to keep building at lower price points. Economic expansions don’t die of old age, but this one is getting long in the tooth. It remains to be seen whether the party will continue once the Fed “takes away the punch” by ending this extraordinary period of the accommodative monetary policy. Looking forward, our forecast model suggests we’ll see single-family permit totals of 1,076 in October, 998 in November, 1,019 in December, and 1,029 in January 2019. With Denver rental vacancy below 4%, we should expect a rebound in multi-family permits. The forecast is for 943 MF permits per month for the six-month period ending January 2019.
(1) https://www.zillow.com/research/mortgage-payments-21610/
(2) https://www.nytimes.com/2007/12/23/business/23view.html
(3) https://www.cnbc.com/2018/11/02/us-created-250000-jobs-in-oct-vs-190000-jobs-expected.html
(4) https://www.federalreserve.gov/monetarypolicy/bst_recenttrends.htm
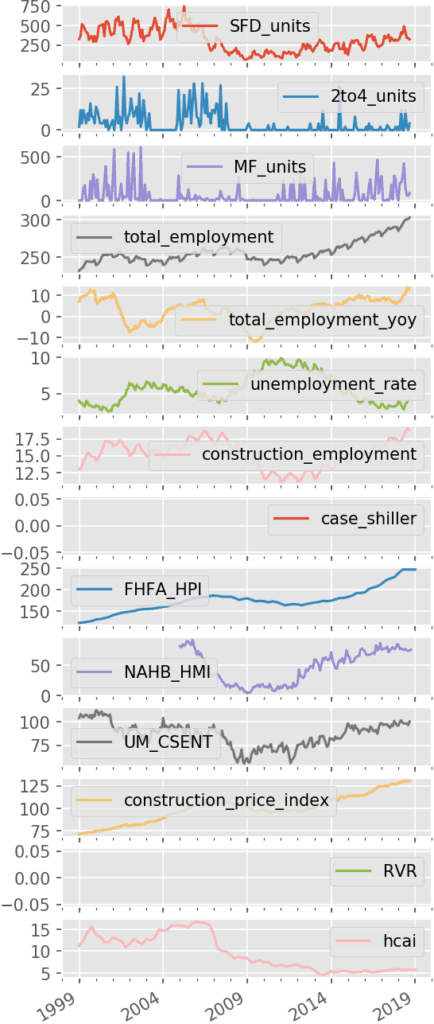
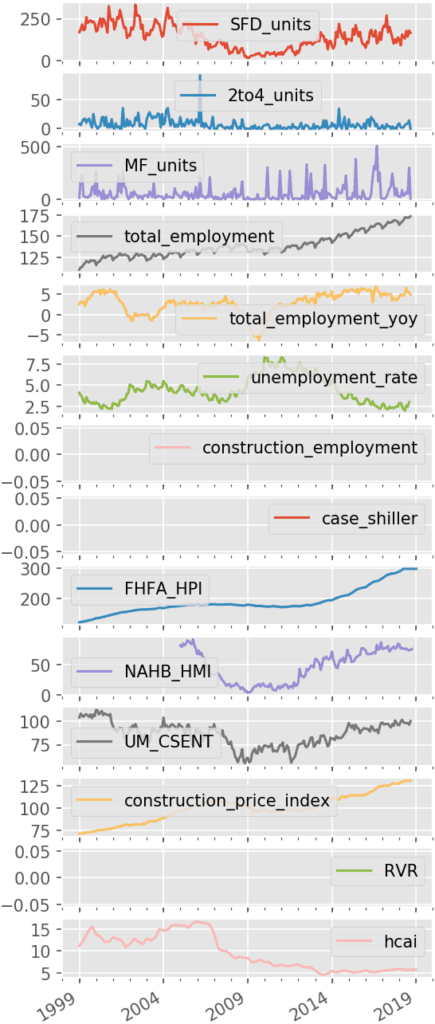
Economic Data Definitions
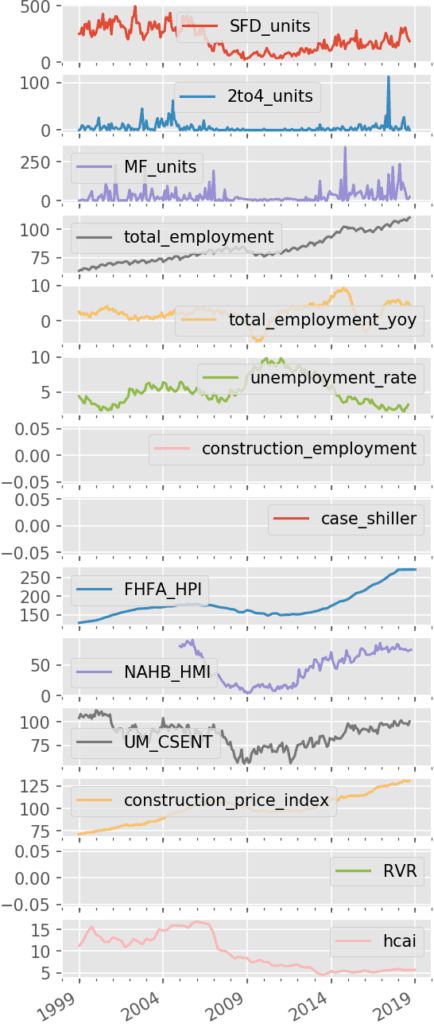
| SFD_units | This is the number of single-family housing permits approved in the metropolitan statistical area (MSA) each month, reported by the Census Bureau. |
| 2to4_units | This is the number of housing permits for units in buildings with two to four total units approved in the MSA each month, reported by the Census Bureau. |
| MF_units | This is the number of housing permits for units in buildings with five or more total units approved in the MSA each month, reported by the Census Bureau. |
| total_employment | This is total employment in the MSA, reported each month by the Bureau of Labor Statistics. |
| total_employment_yoy | This is the change in total employment in the MSA from one year ago. |
| unemployment_rate | This is the U-3 unemployment rate for each MSA reported by the Bureau of Labor Statistics. |
| construction_employment | This is total construction sector employment in the MSA, reported each month by the Bureau of Labor Statistics. This varies by availability in each location, some MSAs report residential building construction employment while some report only construction employment as a whole. |
| case_shiller | This is the S&P CoreLogic Case-Shiller Home Price Index for the MSA. This is a repeat-sales index, tracking price changes for individual homes that have sold multiple times. Jan. 2000 = 100. |
| FHFA_HPI | This is the Federal Housing Finance Agency’s House Price Index for the MSA. This is a repeat-sales index like Case-Shiller, but with coverage for more MSAs. |
| NAHB_HMI | This is the NAHB/Wells Fargo Housing Market Index (HMI) for the Census Region. The HMI is a survey of NAHB members measuring sentiment about the residential construction industry. The HMI is a diffusion index with values between 0-100; sentiment is negative at values below 50, neutral at 50, and positive over 50. |
| UM_CSENT | This is the University of Michigan’s Index of Consumer Sentiment. Survey data is used to estimate consumer optimism or pessimism. This is a national statistic. Mar. 1997 = 100. |
| construction_price_index | This is the Construction Price Index as reported by the Census Bureau, which gives an account of the costs to builders when building new homes. This is a national statistic. 2005 = 100. |
| RVR | This is the rental vacancy rate for the MSA as reported by the Census Bureau’s Housing Vacancies and Homeownership survey. These data are released quarterly and we use linear interpolation to estimate monthly figures. |
| hcai | This is the Housing Credit Availability Index published by the Urban Institute. A lower HCAI indicates that lenders are unwilling to tolerate defaults and are imposing tighter lending standards, while a higher HCAI indicates that lenders are willing to tolerate defaults and are taking more risks. |