The Housing Tides Index™ compares the health of the top 50+ U.S. housing markets.
Whether you’re looking for an aggregated view of the top U.S. markets, or want to analyze a specific metropolitan market, Housing Tides is at your fingertips with its interactive and intuitive interface.
Housing Tides Index Quick Facts
- The Housing Tides Index is a comprehensive measure of market health in an interactive form.
- The Index quantifies and compares the health of the top 50+ U.S. housing markets.
- Markets are scored on a scale of 1 – 100.
- A completely unhealthy market = 0.
- A perfectly healthy market =100.
- Index scores are based on 12 market indicators, sorted into supply, demand, and financial indicators.
Example indicators from each category:
- Housing Supply Indicators - rental vacancy, construction costs, builder sentiment
- Housing Demand Indicators - unemployment, consumer sentiment
- Housing Finance Indicators - median payment to income ratio, mortgage delinquencies
- With the Housing Tides Index, you can quickly gauge key market strengths and weaknesses, such as:
- Housing supply
- Housing permit to employment growth ratio
- Builder Sentiment
Ready to see the housing market with greater resolution and clarity than ever before?
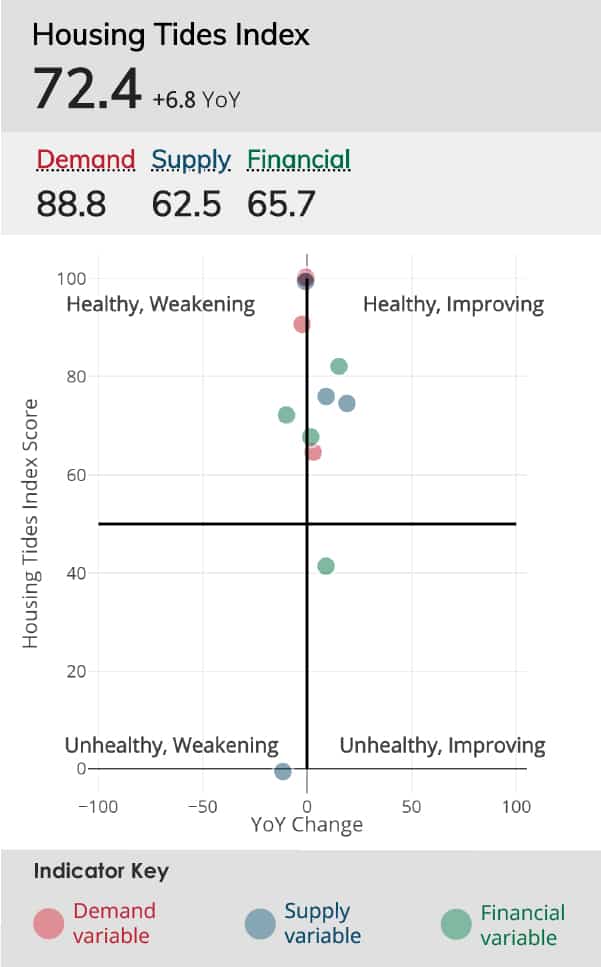
Example Housing Tides Index overview for
New York-Newark-Jersey City, NY-NJ-PA
Data from January 2020.
Gain a Competitive Advantage in Your Market!
Discover the synergy of the Housing Tides Index, Media Analysis, Housing Tides Permit Forecasts™. When you combine the insight from all three, you gain a high-resolution, comprehensive view of the US housing market.
Dive Deeper
Using economic theory, we’ve identified 12 economic indicators that inform a holistic assessment of the health and resilience of local housing markets. For each of these indicators, the Tides team concluded what’s “healthy” by determining ranges that indicate sustainable construction volume, robust housing demand, or sensible lending characteristics. We then allocate Housing Tides Index points according to where each metro area lies with regard to each indicator’s “healthy” range. A perfectly healthy market would receive a score of 100.
Other commercially available national and metropolitan market housing indices, such as the S&P CoreLogic Case-Shiller Index (Case-Shiller Index), include fewer economic indicators and are ultimately lacking of other essential housing industry data. The full Housing Tides interface consists of three powerful components. Each component contributes to the overall value and enables a comprehensive assessment of housing market health, while serving as a complimentary asset to other available indices.