Architectural billings provide an early picture of construction trends

Published March 5, 2020
Architectural Billings: A Tool to Predict Construction Volume
How does a business prepare for market fluctuations? What are the best indicators to predict future construction volume? Architectural billings are an excellent leading indicator.
Developers, builders, and contractors sometimes spend years planning for their properties, long before a permit is pulled or a shovel is put into the ground. Delays in government approvals and securing financing can be timing hurdles for the best-laid plans.
When there is certainty about the zoning entitlements and the capital and financing details have been worked out, builders are ready to hit the heavy spending button. The first payments in the loan draw go to the architect, who has been patiently waiting with brilliant designs.
Architectural billings provide for an early picture of construction trends. I always figure that it would take at least twelve months from the time the plans are started before a building permit could be issued. This is like peeking in the back of the book for answers if you want to know how busy this industry will be in a year.
Example: Tampa Bay Area's ABI
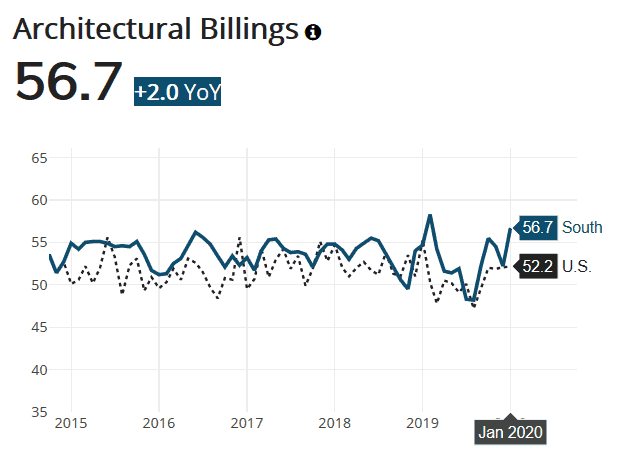
Housing Tides™ monitors architectural billings in major markets. The ABI (Architectural Billings Index) reports architectural billings as a diffusion index, meaning values over 50 indicate an expansion of activity among architectural firms, and values under 50 indicate a contraction.
For instance, the Tampa Bay Area has historically been stable in exceeding the prior year’s billings. Last year in 2019 the report shows some uncharacteristic volatility.
This would prompt me to look more closely into all the other indicators see where this market is going to go. Pick a market of your interest and see what you think.


Ready to explore the depth of data in Housing Tides?
Sign-up for a Housing Tides account to access the interface and dive into the data!
For a limited time only, we're offering complimentary access to Housing Tides. Don't miss out!

About Jeff Whiton
Jeff formerly headed operations for Lennar and KB Home in Colorado building nearly two per cent of the state’s total single-family housing stock. He was honored as Colorado’s Home Builder of the Year in 2001. Whiton also served as the CEO of the Home Builders Association of Metro Denver for eight years reviving the association from near bankruptcy after the Great Recession.