This spring Denver housing permits have slowed while sales have strengthened. Most importantly, the market remains largely healthy and balanced.

Market Indicators and Permit Forecasts
(Click to expand sections and see charts)
Not familiar with some of the terms below? Jump down to our economic data definitions.


Economic Data Definitions
Housing Permits Have Slowed Overall
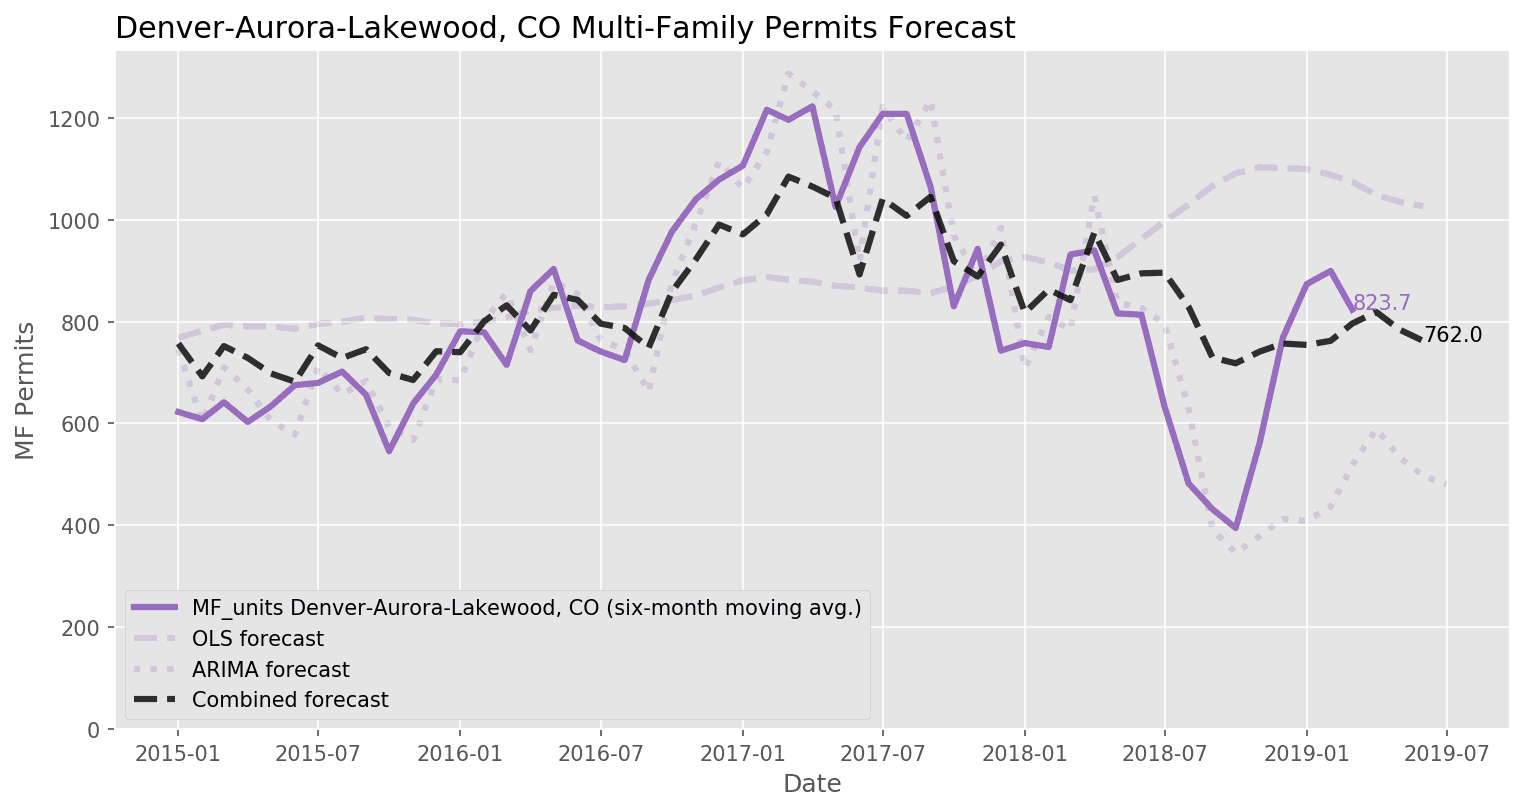
Denver housing permits didn’t “pop” as we might have hoped to start the favorable spring construction season, as the City approved just 764 single-family permits in March, little changed when compared to the first two months of the year. This means the permit total is down 27.5% year-over-year (from 1,054 in March 2018). Our forecast models called for a sizable increase to 1,031 permit approvals in March. Denver approved 778 multi-family permits in March, in-line with the forecast but down considerably from 1,537 in March 2018.
Unemployment Rate Remains Low, Total Jobs Increase by 1.5%
While the Denver unemployment rate remains low at 3.3% – and applications for unemployment benefits recently fell to a 49-year low nationally (1) – Denver employment growth is slowing, with the metro adding 23.3k new jobs in the last twelve months versus 49.3k for the year ending March 2018. This corresponds to a 1.5% increase in total Denver jobs in the last year, positioning Denver solidly in the middle amongst major U.S. metro areas and trailing other Front Range markets (Fort Collins: 3.1%; Greeley: 3.0%; Colorado Springs: 1.8%).
Falling Mortgage Rates Motivate Buyers
Prevailing U.S. mortgage rates continued to fall through the spring months, dropping from 4.94% in November to 4.17% in the week ending April 18. Denver home sales have risen correspondingly, up meaningfully both year-over-year and month-over-month. There are more homes listed for sale than in recent past, but the increase in the sales rate means that the current inventory would be exhausted in just 1.4 months; there is still no sign of oversupply in Denver.
Median Home Price Increased by 1.4% Compared to Previous Year
The fall in mortgage rates has coincided with a rebound in homebuilder and consumer confidence, which signal that market participants are now more optimistic than they were when sentiment declined in late 2018. However, the abatement in interest rates and increase in sales have not led to a resurgence in home prices, and instead Denver price appreciation continues to slow. Redfin reports that the median sales price was $409k in March, up just 1.4% from one year ago. This could be due in part to the stronger demand for entry-level housing, with smaller, less expensive units selling more quickly than luxury homes (2). On the other hand, rental prices in Denver are up 5% in the past year and the median unit now rents for $2,100 a month. I expect both the supply of and demand for rental units to persist, given the current state of relatively high home prices and the uncertain outlook for interest rates and economic growth over the next year.
April – June 2019 Permit Forecasts
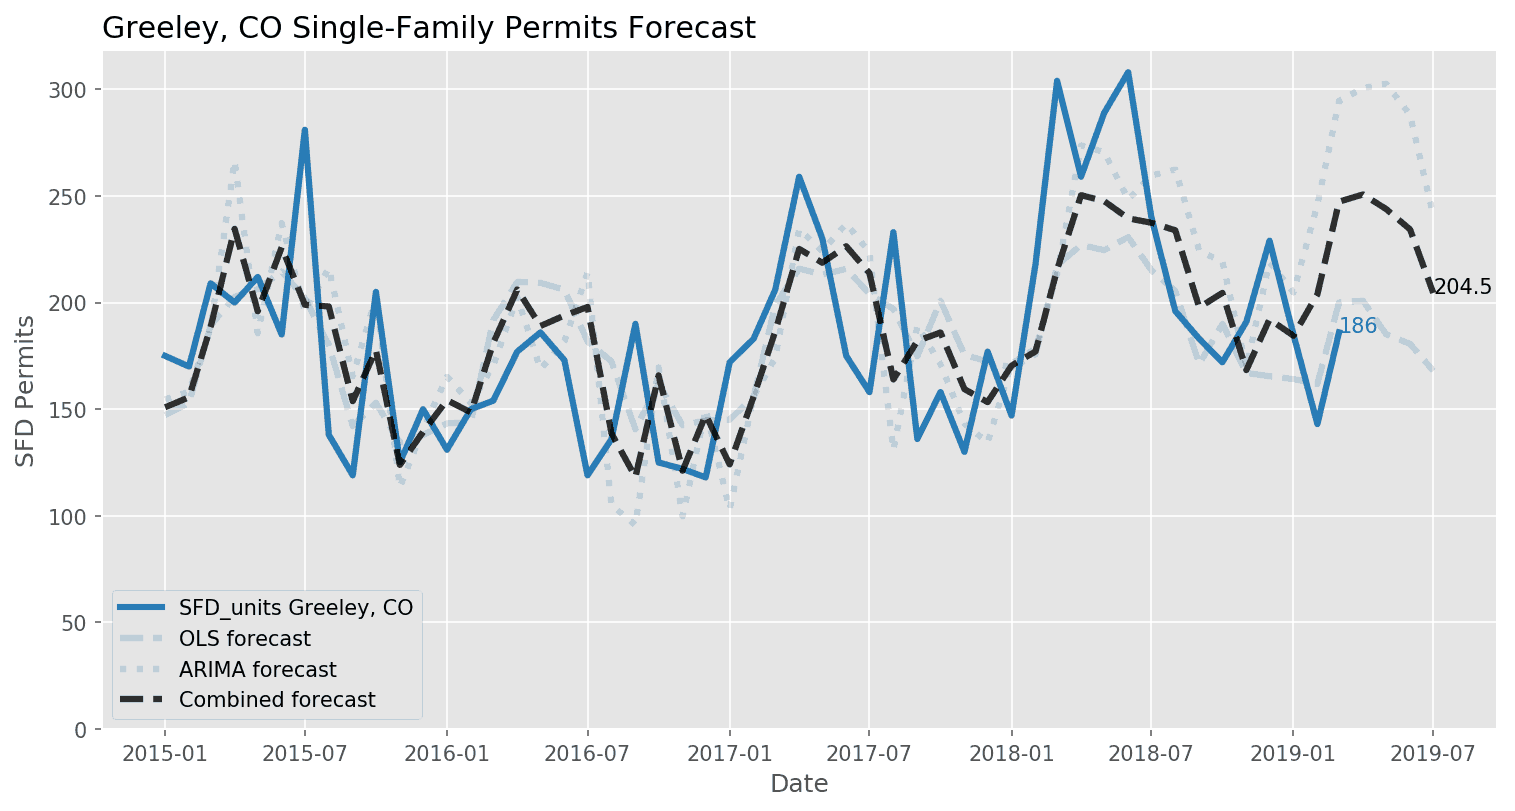
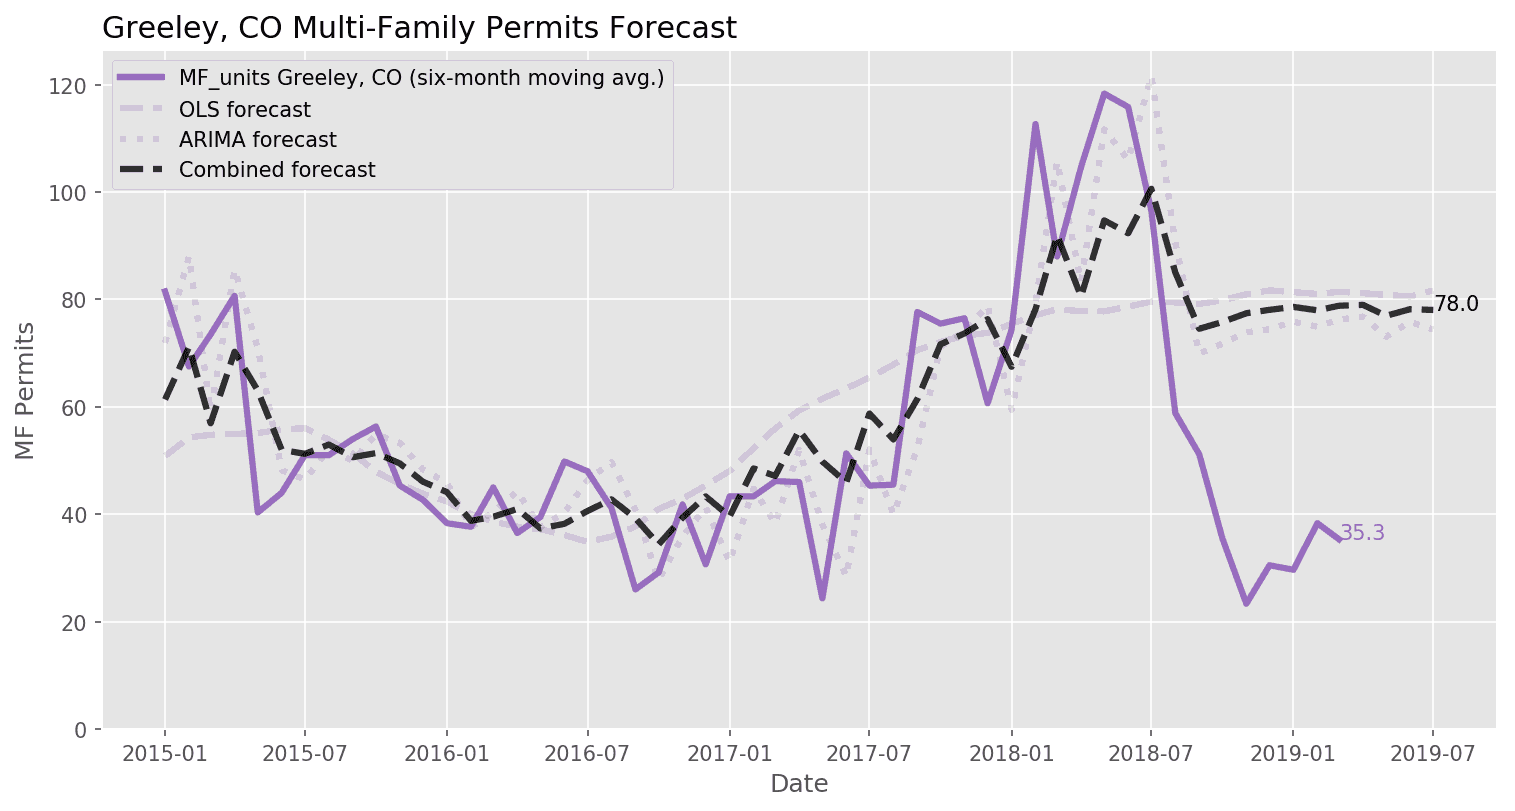
Looking forward, we’re forecasting Denver single-family permit totals of 1,051 in April, 1,058 in May, and 1,027 in June, all of which are lower than the corresponding months in 2018. Similarly, our forecast models suggest a rate of 762 multi-family permit approvals per month for the six-month period ending in June, consistent with the current pace of construction but a 33% decline from the rate of multi-family construction for the same period last year.
Sources
(1) https://www.cnbc.com/2019/04/18/weekly-jobless-claims.html
(2) https://www.cnbc.com/2019/04/04/home-prices-hit-a-new-record.html
| SFD_units | This is the number of single-family housing permits approved in the metropolitan statistical area (MSA) each month, reported by the Census Bureau. |
| 2to4_units | This is the number of housing permits for units in buildings with two to four total units approved in the MSA each month, reported by the Census Bureau. |
| MF_units | This is the number of housing permits for units in buildings with five or more total units approved in the MSA each month, reported by the Census Bureau. |
| total_employment | This is total employment in the MSA, reported each month by the Bureau of Labor Statistics. |
| total_employment_yoy | This is the change in total employment in the MSA from one year ago. |
| unemployment_rate | This is the U-3 unemployment rate for each MSA reported by the Bureau of Labor Statistics. |
| construction_employment | This is total construction sector employment in the MSA, reported each month by the Bureau of Labor Statistics. This varies by availability in each location, some MSAs report residential building construction employment while some report only construction employment as a whole. |
| case_shiller | This is the S&P CoreLogic Case-Shiller Home Price Index for the MSA. This is a repeat-sales index, tracking price changes for individual homes that have sold multiple times. Jan. 2000 = 100. |
| FHFA_HPI | This is the Federal Housing Finance Agency’s House Price Index for the MSA. This is a repeat-sales index like Case-Shiller, but with coverage for more MSAs. |
| NAHB_HMI | This is the NAHB/Wells Fargo Housing Market Index (HMI) for the Census Region. The HMI is a survey of NAHB members measuring sentiment about the residential construction industry. The HMI is a diffusion index with values between 0-100; sentiment is negative at values below 50, neutral at 50, and positive over 50. |
| UM_CSENT | This is the University of Michigan’s Index of Consumer Sentiment. Survey data is used to estimate consumer optimism or pessimism. This is a national statistic. Mar. 1997 = 100. |
| construction_price_index | This is the Construction Price Index as reported by the Census Bureau, which gives an account of the costs to builders when building new homes. This is a national statistic. 2005 = 100. |
| RVR | This is the rental vacancy rate for the MSA as reported by the Census Bureau’s Housing Vacancies and Homeownership survey. These data are released quarterly and we use linear interpolation to estimate monthly figures. |
| hcai | This is the Housing Credit Availability Index published by the Urban Institute. A lower HCAI indicates that lenders are unwilling to tolerate defaults and are imposing tighter lending standards, while a higher HCAI indicates that lenders are willing to tolerate defaults and are taking more risks. |