
Colorado housing permits rebound from a slow start to the year.

Denver Housing Holds Steady
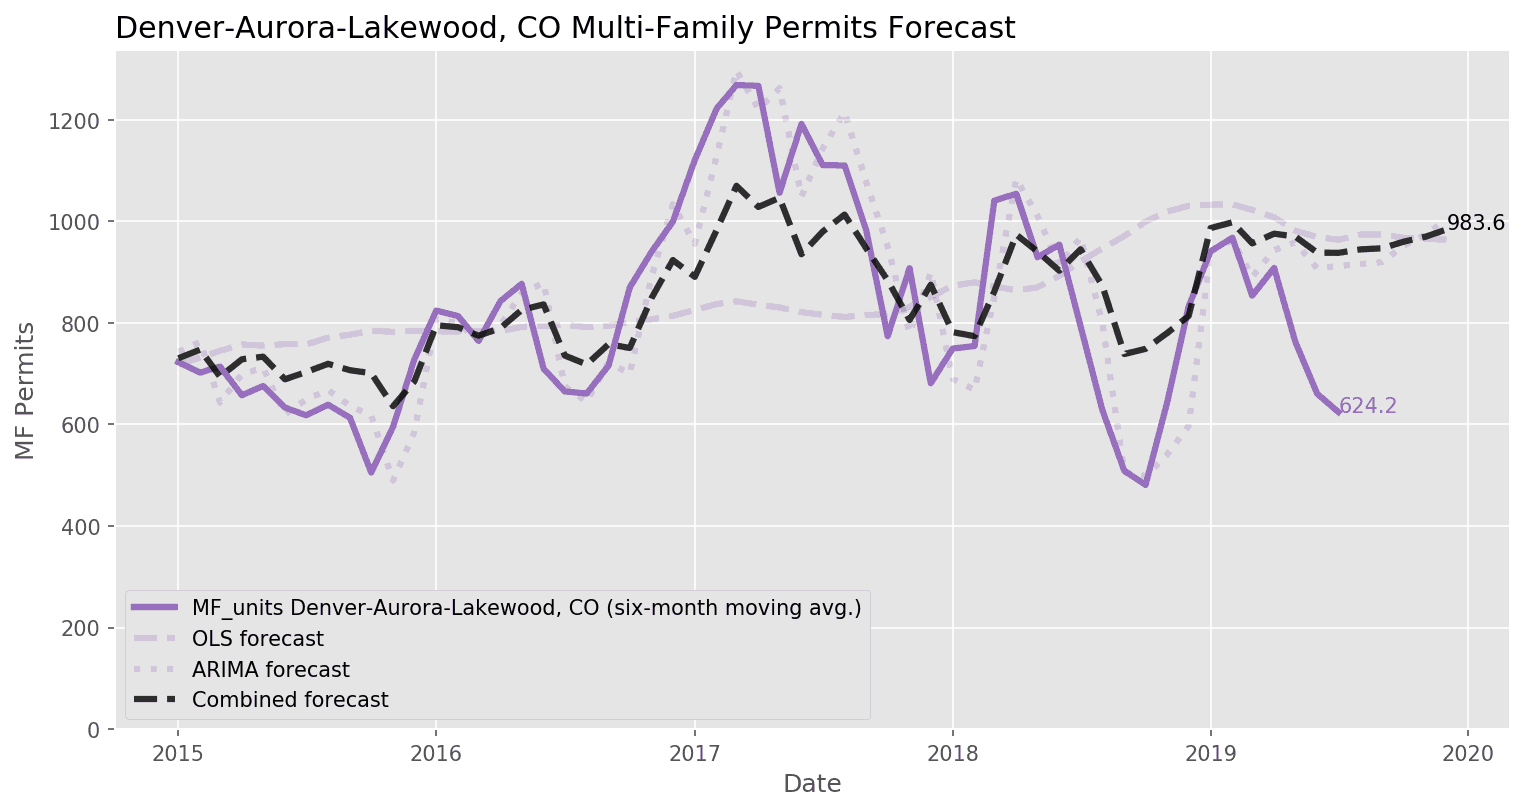
While not exceptional, plans for Denver housing have been solid this summer, recording four straight months with single-family permit approvals above 900. This is reassuring following the weakness in volume we saw over the winter and into early spring. July's total of 1,052 single-family detached (SFD) permits is 15% higher than July 2018, but the strength exhibited in the last several months has not been enough to offset the slow start to the year; there have been ~900 (12%) fewer single-family homes permitted in the Denver metro area through the first seven months of 2019 compared to the same period in 2018. Contrary to my expectations, permits for Denver multi-family (MF) housing have fallen meaningfully in the last few months, good for a rate of just 624 MF permits per month over the last half-year. While still low, rental vacancy has increased modestly and rent prices are flat year-over-year, and with housing prices continuing to rise (+4.2% YoY to $427k) we can expect the tides to change for multi-family in the coming months.
Sustained Demand for New Homes
It appears that new home sales are benefitting from a homebuilder pivot to lower-priced units and this year's mortgage rate decline. While the median sales price for new homes nationally has fallen 4% from a year ago, it's likely that this has been driven at least in part by builder efforts to build smaller to appeal to the entry-level buyer (1). The Census Bureau reports that new home sales hit a decade-high annual rate in June, and with 6.4 months of supply at the current sales rate the market for newly-constructed housing remains intact (2).
Spotlight on Consumers
Moreover, on the whole, consumers remain confident and their wages are rising. The University of Michigan consumer sentiment survey showed a decline in both the assessment of current conditions as well as future expectations, though both measures remain historically high. The Bureau of Labor Statistics reports that median weekly earnings increased 3.7% in the second quarter of 2019 when compared to a year earlier (3) - a slower pace than home price appreciation, but one faster than that of inflation. A strong and confident consumer is essential to American economic growth and it looks like the situation remains favorable, but will consumer optimism and demand for housing bolster construction?
Economic Uncertainty Tests Business Planning
Uncertainty makes planning for the future a challenge, and business leaders are grappling with an uncertain economic environment, largely due to capricious signaling from government on what to expect from monetary, fiscal and trade policy. For example, the stock market swoon Friday, August 23, 2019 was a reaction to new attacks on the Federal Reserve and a surprise escalation of tariffs in the form of a series of tweets from President Trump. Homebuilder sentiment has thus far only taken a small ding, but as we know, planning new construction projects takes a significant amount of time, and builders need clarity on tax, cost and other aspects of their business environment if they're to make sizable investments. They're not getting that from this administration. Denver for-sale housing totaled just 1.6 months of supply in July and the metro continues to add jobs at a steady pace, so there's clearly a need for more housing in our area. However, I wouldn't be surprised to see builders pull back on the reins somewhat given the difficulties in reconciling the mixed signals they're receiving.
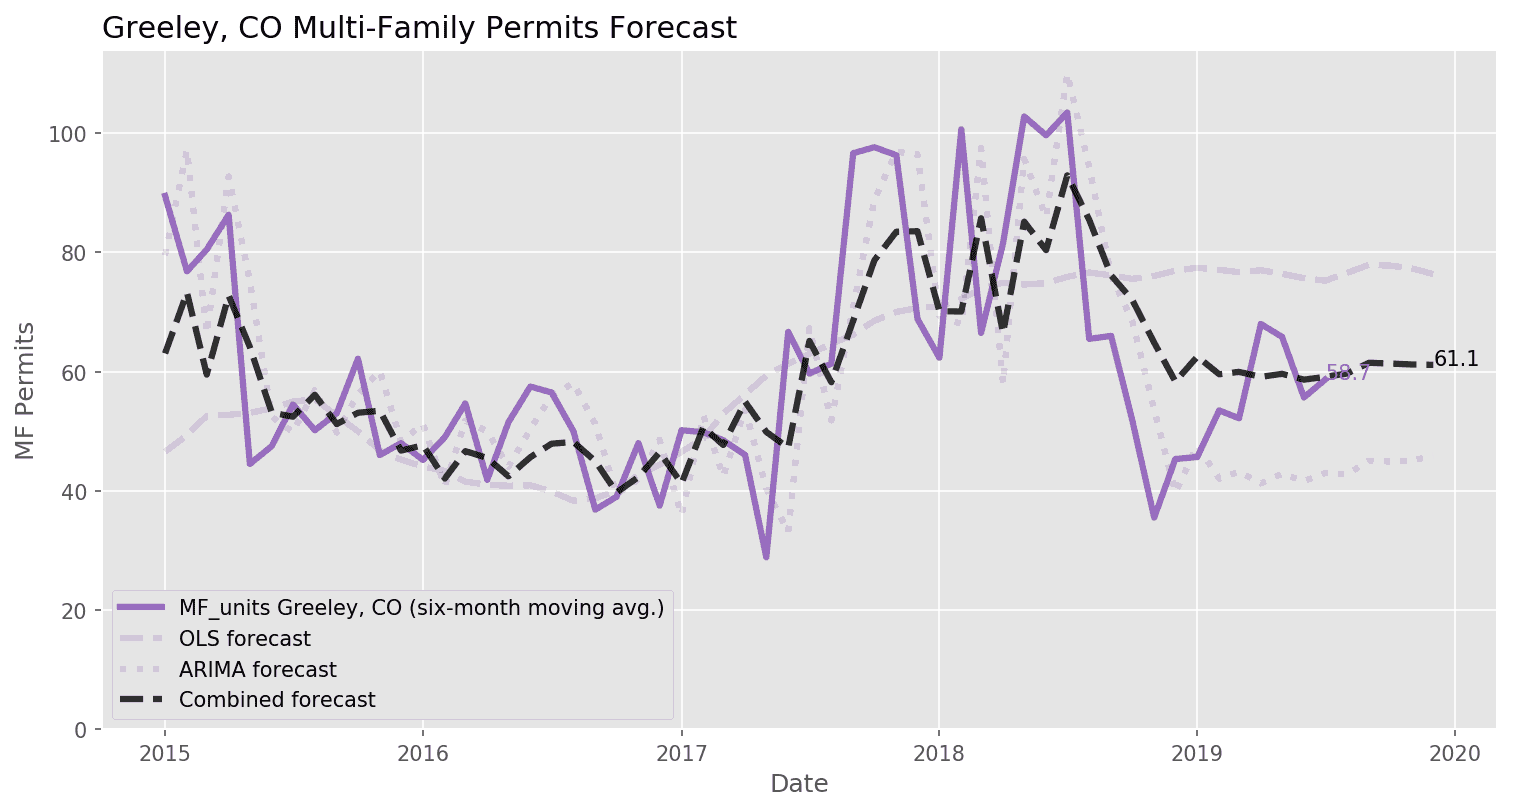
Forecasting the Final Months of 2019
Overall, the forecast is for a mild slowdown in construction to end the year, and we can expect SFD permit totals of 912 in August, 816 in September, 918 in October, 798 in November, and 798 in December. If the forecast proves accurate this would entail a total permits decline of ~7% compared to the same period in 2018. The multi-family forecast is for a rate of 984 permits per month for the six-month period ending in December. Given the present slowdown in multi-family volume, this forecast suggests a sizable increase in the pace of construction.
Sources
(1) http://eyeonhousing.org/2019/05/new-single-family-home-size-first-quarter-2019-data/
(2) https://www.census.gov/construction/nrs/pdf/newressales.pdf
(3) https://www.bls.gov/opub/ted/2019/median-weekly-earnings-for-second-quarter-2019-increased-by-3-point-7-percent-over-the-year.htm
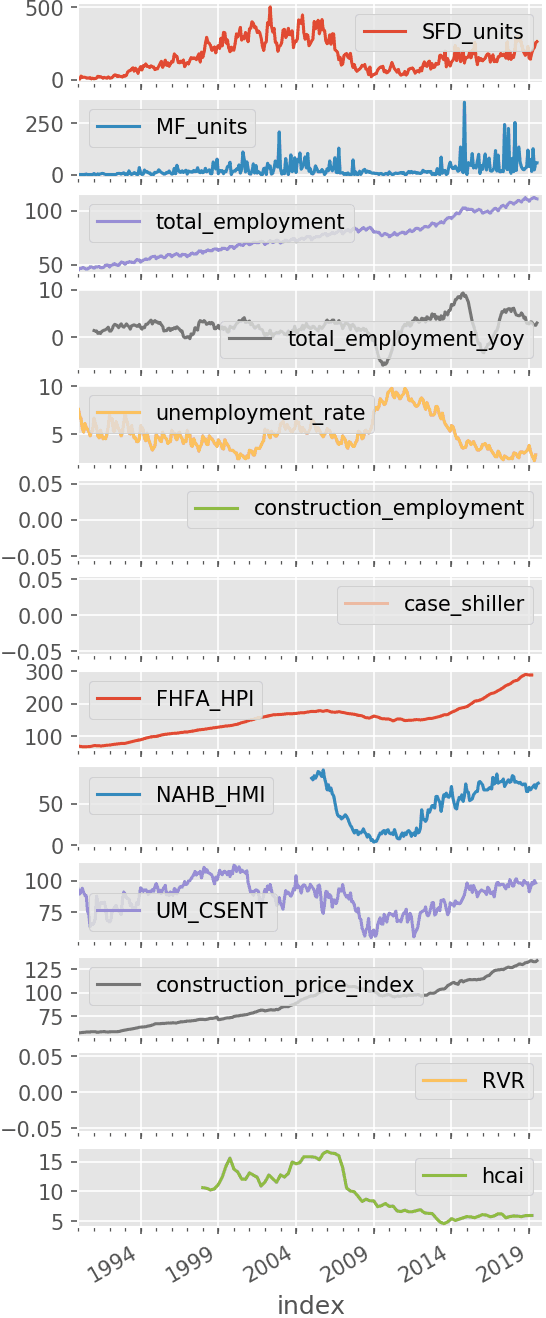
Market Indicators and Permit Forecasts
(Click to expand sections and see charts)
Not familiar with some of the terms below? Jump down to our economic data definitions.


Not familiar with some of the terms above? Jump down to our economic data definitions.
Economic Data Definitions
| SFD_units | This is the number of single-family housing permits approved in the metropolitan statistical area (MSA) each month, reported by the Census Bureau. |
| 2to4_units | This is the number of housing permits for units in buildings with two to four total units approved in the MSA each month, reported by the Census Bureau. |
| MF_units | This is the number of housing permits for units in buildings with five or more total units approved in the MSA each month, reported by the Census Bureau. |
| total_employment | This is total employment in the MSA, reported each month by the Bureau of Labor Statistics. |
| total_employment_yoy | This is the change in total employment in the MSA from one year ago. |
| unemployment_rate | This is the U-3 unemployment rate for each MSA reported by the Bureau of Labor Statistics. |
| construction_employment | This is total construction sector employment in the MSA, reported each month by the Bureau of Labor Statistics. This varies by availability in each location, some MSAs report residential building construction employment while some report only construction employment as a whole. |
| case_shiller | This is the S&P CoreLogic Case-Shiller Home Price Index for the MSA. This is a repeat-sales index, tracking price changes for individual homes that have sold multiple times. Jan. 2000 = 100. |
| FHFA_HPI | This is the Federal Housing Finance Agency’s House Price Index for the MSA. This is a repeat-sales index like Case-Shiller, but with coverage for more MSAs. |
| NAHB_HMI | This is the NAHB/Wells Fargo Housing Market Index (HMI) for the Census Region. The HMI is a survey of NAHB members measuring sentiment about the residential construction industry. The HMI is a diffusion index with values between 0-100; sentiment is negative at values below 50, neutral at 50, and positive over 50. |
| UM_CSENT | This is the University of Michigan’s Index of Consumer Sentiment. Survey data is used to estimate consumer optimism or pessimism. This is a national statistic. Mar. 1997 = 100. |
| construction_price_index | This is the Construction Price Index as reported by the Census Bureau, which gives an account of the costs to builders when building new homes. This is a national statistic. 2005 = 100. |
| RVR | This is the rental vacancy rate for the MSA as reported by the Census Bureau’s Housing Vacancies and Homeownership survey. These data are released quarterly and we use linear interpolation to estimate monthly figures. |
| hcai | This is the Housing Credit Availability Index published by the Urban Institute. A lower HCAI indicates that lenders are unwilling to tolerate defaults and are imposing tighter lending standards, while a higher HCAI indicates that lenders are willing to tolerate defaults and are taking more risks. |


