Colorado Housing Market Forecast – September 2019

Colorado Housing Market Forecast - September - 2019

Single and multi-family construction permit activity diverge in recent months. Lower mortgage rates reinforce builder confidence, but consumers say it's not a good time to buy a home and remain wary of a recession in 2020.

Colorado Housing Market Forecast - November 2019

Mixed Results in August and September

With a surprise show of strength Denver saw 1,256 single-family housing permits approved in August, the highest monthly total since June 2006. However, the spike was short-lived, as activity fell by over a third month-over-month, with just 830 SFD approvals in September. Multi-family activity fell too, with only 303 and 230 Denver MF permits approved in August and September. The decline pulled the six-month average rate down to just 523 permits per month, the slowest pace in nearly a year.

Renters Get More Options

The multi-family slowdown may be attributed in part to increased availability of rental units in the metro area. The U.S. Census estimates that Denver rental vacancy rose from 2.5% in 2018 Q2 to 5.4% in 2019 Q3, and savvy multi-family developers are surely wary of committing to too many projects and oversupplying the market.1 Still, we’d be wise to monitor rental vacancy in conjunction with measures of supply of for-sale units; Redfin reports that for-sale inventory constitutes just 1.8 months of supply at the current sales pace, suggesting that housing demand continues to exceed supply. This will support multi-family absorption for the foreseeable future, especially if annual rent appreciation slows from the robust 7.5% rise observed in September.

Construction and Job Growth in Harmony

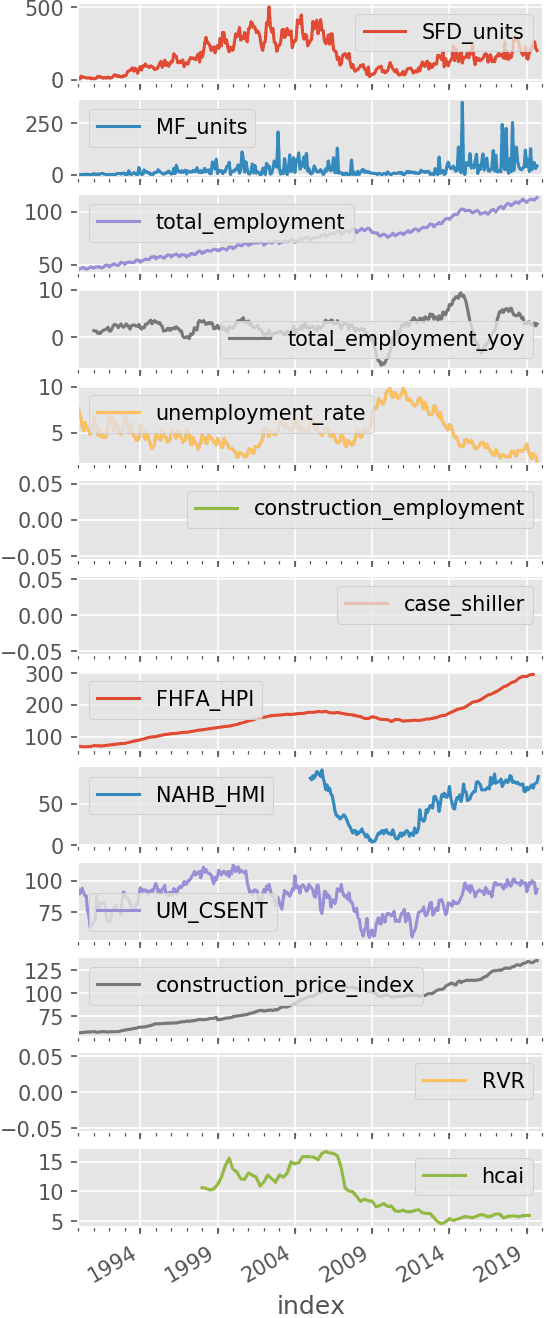
The slowing pace of Denver-area homebuilders may prove to be prescient in hindsight, as the timing coincides with a general slowing of Denver job market growth as well. The metro area added just 24k jobs in the last year, down from a peak of 41k in early 2018.2 Builders have filed plans to construct 0.8 homes per job added in the area in the last twelve months, a level which is broadly understood to support a sustainable market balanced between homebuyers and sellers. This ratio dipped as low as 0.25 – meaning the metro was adding four jobs per new home built – in recent years, and it’s encouraging to note that builders appear to have their plans well-calibrated to the current level of demand.

Builder Outlook Strengthened by Cheaper Loans

Furthermore, builders tell us that they’re confident in their prospects, with the NAHB Housing Market Index survey continuing to rise swiftly after tumbling throughout 2018. Homebuilders are as confident about current and future sales as they’ve been since late 2005. Homebuilders in the U.S. West region are among the most optimistic, which is corroborated by renewed growth in the volume of work reported by West region architecture firms.3 Survey participants surely see their outlook bolstered by the recent fall in mortgage interest rates, which, currently at 3.75%, are a full percentage point lower than one year ago. They may fall further still.4

Dive In!


Access the data behind our market analysis.
Explore the Housing Tides Interface.
Permit forecasts, media analysis, and more!

Follow Market Tides


EnergyLogic Corporate Blog

Consumers Eyeing Recession?

While consumers remain solidly positive in their assessment of current economic conditions, they’ve expressed greater concern about how they’ll fare in the months ahead.5 While refinance and home purchase activity has surged with the drop in interest rates, surveyed consumers noted that the conditions for purchasing a home are as poor as they’ve been in over 10 years.6 The consumer’s sizable contribution to U.S. economic activity means that we should closely follow the aggregate consumer outlook; decisions to delay or cancel big-ticket purchases can have broader ripple effects.

Looking Ahead

In the months ahead, we’re expecting a continued, moderate slowing of single-family construction permit activity in the Denver metro area. We predict SFD permit totals of 835 in October, 713 in November, 715 in December, 704 in January, and 688 in February 2020, with around half of the decline attributable to the typical seasonal effects. Despite underperforming in recent months, we maintain our optimistic forecast for multi-family construction in the near-term. We expect a rate of 972 multi-family permit approvals for the six-month period ending February 2020 – a sizable increase from the current rate.

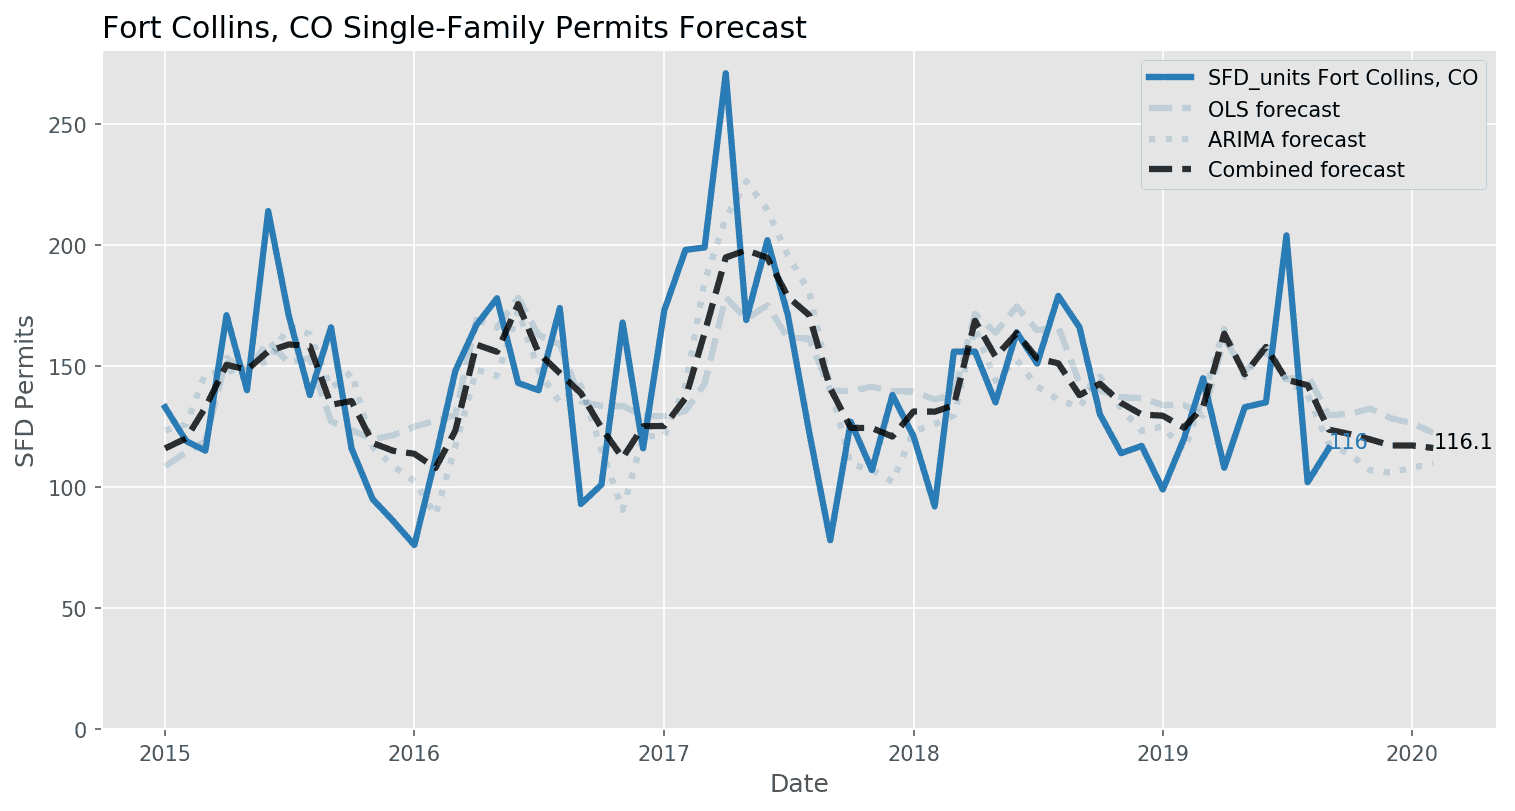
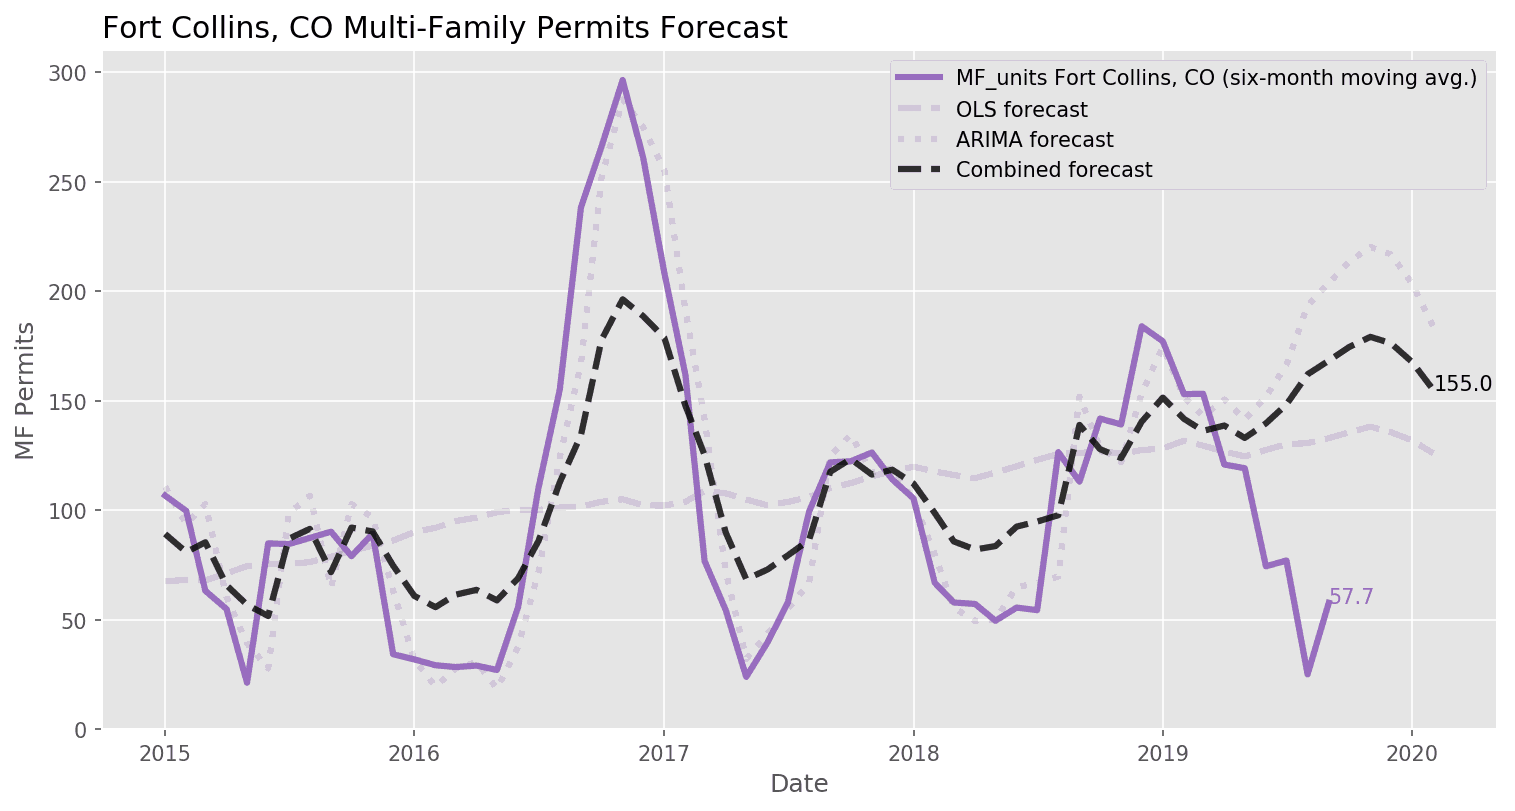
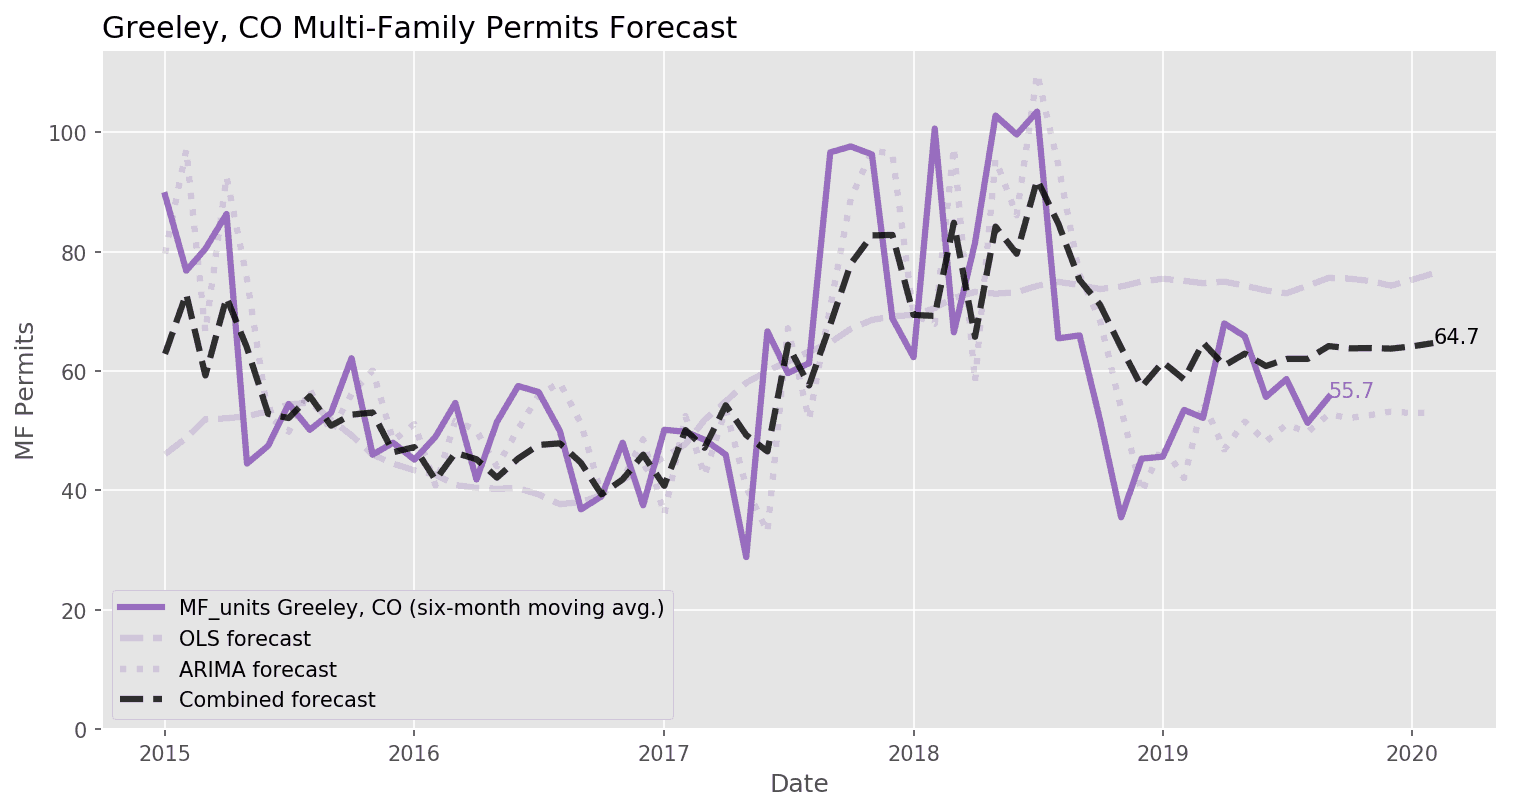
Market Indicators and Permit Forecasts for Colorado Markets

(Click to expand sections and see charts)

Not familiar with some of the terms below? Jump down to our economic data definitions.

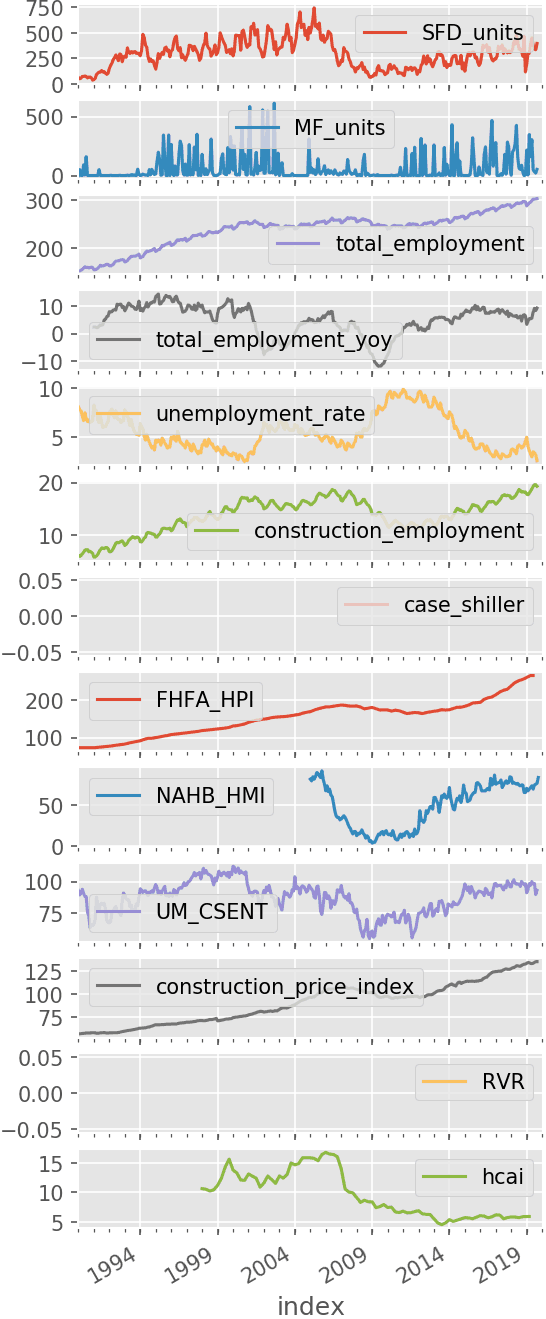
Economic Data Definitions


SFD units

This is the number of single-family housing permits approved in the metropolitan statistical area (MSA) each month, reported by the Census Bureau.

2to4 units

This is the number of housing permits for units in buildings with two to four total units approved in the MSA each month, reported by the Census Bureau.

MF units

This is the number of housing permits for units in buildings with five or more total units approved in the MSA each month, reported by the Census Bureau.

total employment

This is total employment in the MSA, reported each month by the Bureau of Labor Statistics.

total employment yoy

This is the change in total employment in the MSA from one year ago.

unemployment rate

This is the U-3 unemployment rate for each MSA reported by the Bureau of Labor Statistics.

construction employment

This is total construction sector employment in the MSA, reported each month by the Bureau of Labor Statistics. This varies by availability in each location, some MSAs report residential building construction employment while some report only construction employment as a whole.

case shiller

This is the S&P CoreLogic Case-Shiller Home Price Index for the MSA. This is a repeat-sales index, tracking price changes for individual homes that have sold multiple times. Jan. 2000 = 100.

FHFA HPI

This is the NAHB/Wells Fargo Housing Market Index (HMI) for the Census Region. The HMI is a survey of NAHB members measuring sentiment about the residential construction industry. The HMI is a diffusion index with values between 0-100; sentiment is negative at values below 50, neutral at 50, and positive over 50.

NAHB HMI

This is the number of housing permits for units in buildings with two to four total units approved in the MSA each month, reported by the Census Bureau.

UM CSENT

This is the University of Michigan’s Index of Consumer Sentiment. Survey data is used to estimate consumer optimism or pessimism. This is a national statistic. Mar. 1997 = 100.

construction price index

This is the Construction Price Index as reported by the Census Bureau, which gives an account of the costs to builders when building new homes. This is a national statistic. 2005 = 100.

RVR

This is the rental vacancy rate for the MSA as reported by the Census Bureau’s Housing Vacancies and Homeownership survey. These data are released quarterly and we use linear interpolation to estimate monthly figures.

hcai

This is the Housing Credit Availability Index published by the Urban Institute. A lower HCAI indicates that lenders are unwilling to tolerate defaults and are imposing tighter lending standards, while a higher HCAI indicates that lenders are willing to tolerate defaults and are taking more risks.

Dive In!


Access the data behind our market analysis.
Explore the Housing Tides Interface.
Permit forecasts, media analysis, and more!

Follow Market Tides


EnergyLogic Corporate Blog
About the Author
Jonathan Scott

Jonathan Scott

Jonathan is EnergyLogic's data scientist. He enjoys answering questions, solving problems, and finding hidden insights in the vast amount of data EL generates every day. Jonathan studied economics at CSU. In 2021, Jonathan set off on new adventures. We're so thankful to all that he contributed to our team and Housing Tides.

Leave a Reply

Your email address will not be published. Required fields are marked *