
It is a public benefit to have a housing market that is constantly moving toward equilibrium where supply and demand meet.

Published March 24, 2020
Supply and Demand Imbalance
Housing Tides™ follows the most productive, thriving metropolitan areas in the United States. Perhaps I am stating the obvious, most of the cities have housing that is over-valued and under-supplied. Why is that?
At the root of all this are the local governments which control the pipeline. Anti-growth sentiment and NIMBYism keep the housing market from moving toward equilibrium. Local governments are ineffective in being able to support the development of affordable and attainable housing.
Why We Can't Reach Equilibrium
Building attainable or affordable housing in a quantity that the markets demand is hindered by excessive regulations, slow processing, heavy developer extractions and the protections demanded by the elite NIMBYs. These hindrances drive up the price of housing exceeding the current income levels in these markets.
City councils struggle with affordable housing policies that rarely produce the results demanded by the market. When you see “Inclusionary Zoning” on the municipal docket, beware of what comes next. A housing policy based on sound economics will be messed up by bureaucratic intervention. Politicians will be quick to point out that they supported affordable housing when election time rolls around, yet their good intentions produce meager results.
Highlighting Asymmetry
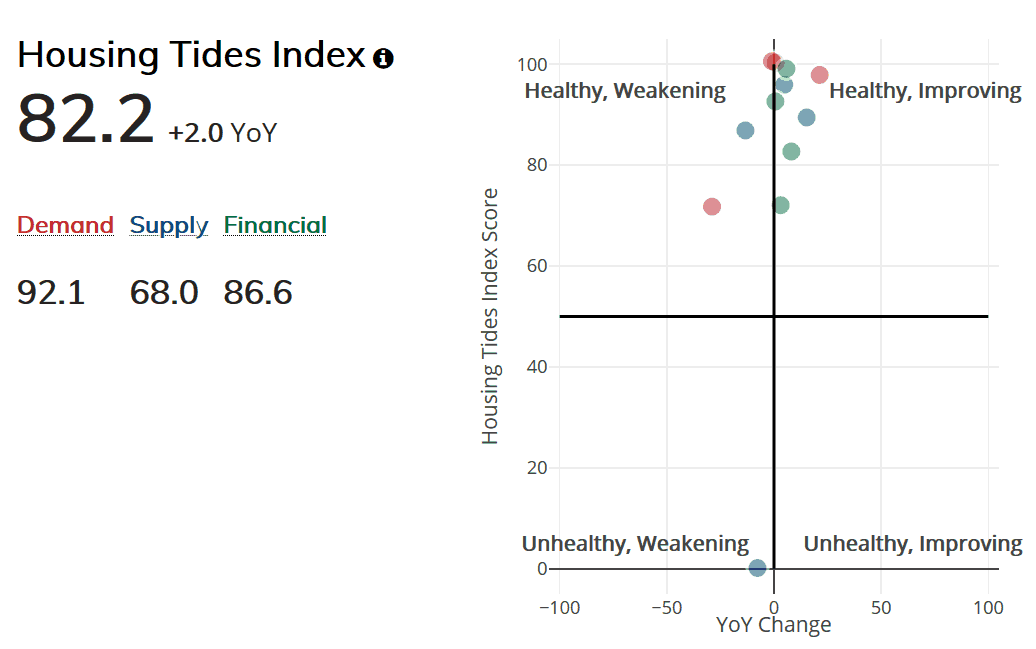
The Housing Tides Index is comprised of demand, supply and financial indicators which provide a holistic view of housing market conditions in cities across the U.S.
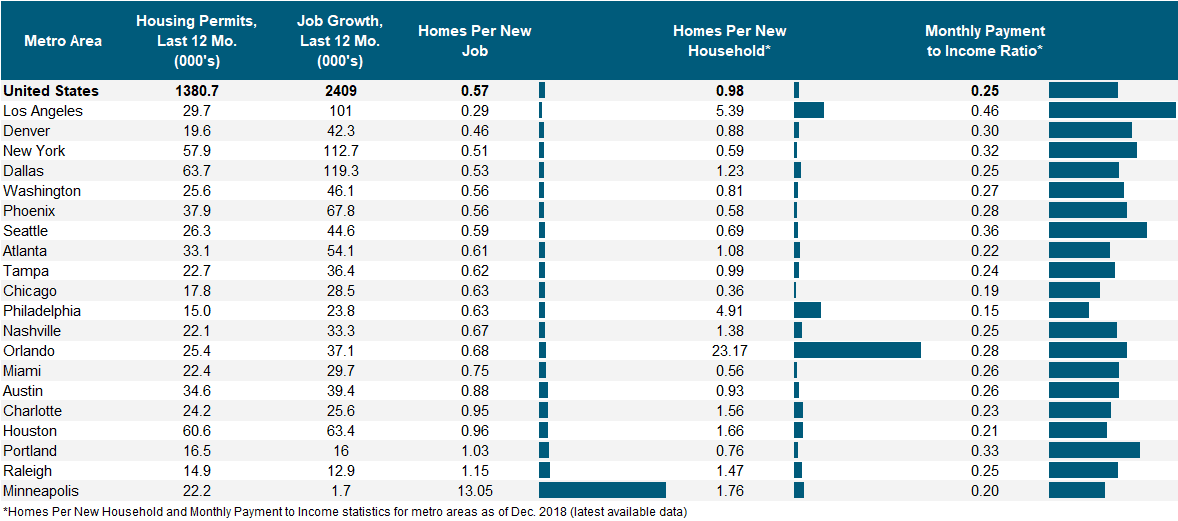
Two ways we assess housing demand are to 1) compare permits for new housing to employment growth and 2) compare permits to household formations.
A balanced market builds 0.5-1.0 homes per new job and one home per new household formed. In the table below we can see Housing Tides data for these indicators in the top twenty housing markets by permit volume. Note that metro areas that are failing to build sufficient housing to keep up with job and household growth tend to face the greatest affordability challenges.


Evaluate Opportunities with Housing Tides™
Ready to explore the depth of data in Housing Tides?
Sign-up for a Housing Tides account to access the interface and dive into the data!
For a limited time only, we're offering complimentary access to Housing Tides. Don't miss out!

About Jeff Whiton
Jeff formerly headed operations for Lennar and KB Home in Colorado building nearly two per cent of the state’s total single-family housing stock. He was honored as Colorado’s Home Builder of the Year in 2001. Whiton also served as the CEO of the Home Builders Association of Metro Denver for eight years reviving the association from near bankruptcy after the Great Recession.