Materials are more expensive, IECC standards are advancing, and the cost of land is rising, but what's really driving increasing costs?

Published March 11, 2021
Exploring the Causes of Rising Homebuilding Costs
Our last piece on U.S. Residential Energy Efficiency Policy outlined progress made and goals to be attained in energy policy, touching on housing affordability.
In this piece, we are digging into the reality of the increasing cost of building a home. Every aspect of building a home has increased over the past decade. Specifically, we are examining the cost increases from 2013 to 2019. This data is the latest available and comes from the NAHB Economics and Housing Policy Group. They surveyed over 6,500 builders and obtained useable information from 49 builders. Thus, it is a small sample size, and as they note, should be used with caution. However, the resolution is significant enough to make broad, national-based inferences for our purposes.
Our Assumptions:
- We've designated insulation and lighting as IECC related aspects.
- We've also estimated a portion of the HVAC cost increase to account for increased duct leakage requirements (50% of the cost to be conservative and not underestimate IECC impact).
- Increased minimum federal efficiency standards also account for some cost increases, but those are not technically IECC related.
- Increases in heating and cooling equipment efficiencies are difficult to assess, as changes in market capture by new equipment ultimately reach a tipping point and pricing comes near parity. The level of resolution for that particular facet of price increases is beyond the scope of this piece.
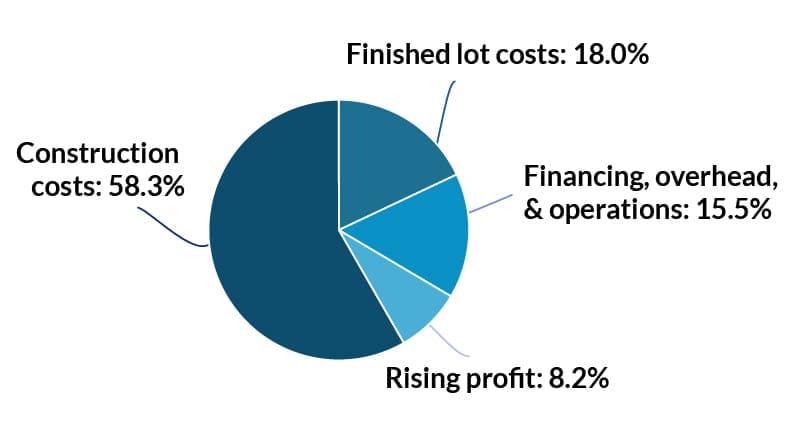
Slices of the Pie
When we look at the total increase in the sales price of a home:
- 18% goes to increases in finished lot costs
- 15.5% goes to increases in the financing, overhead, and other operational items
- 8.2% goes to increases in profit.
- 58.3%, the lion's share, is accounted for by increased construction costs.
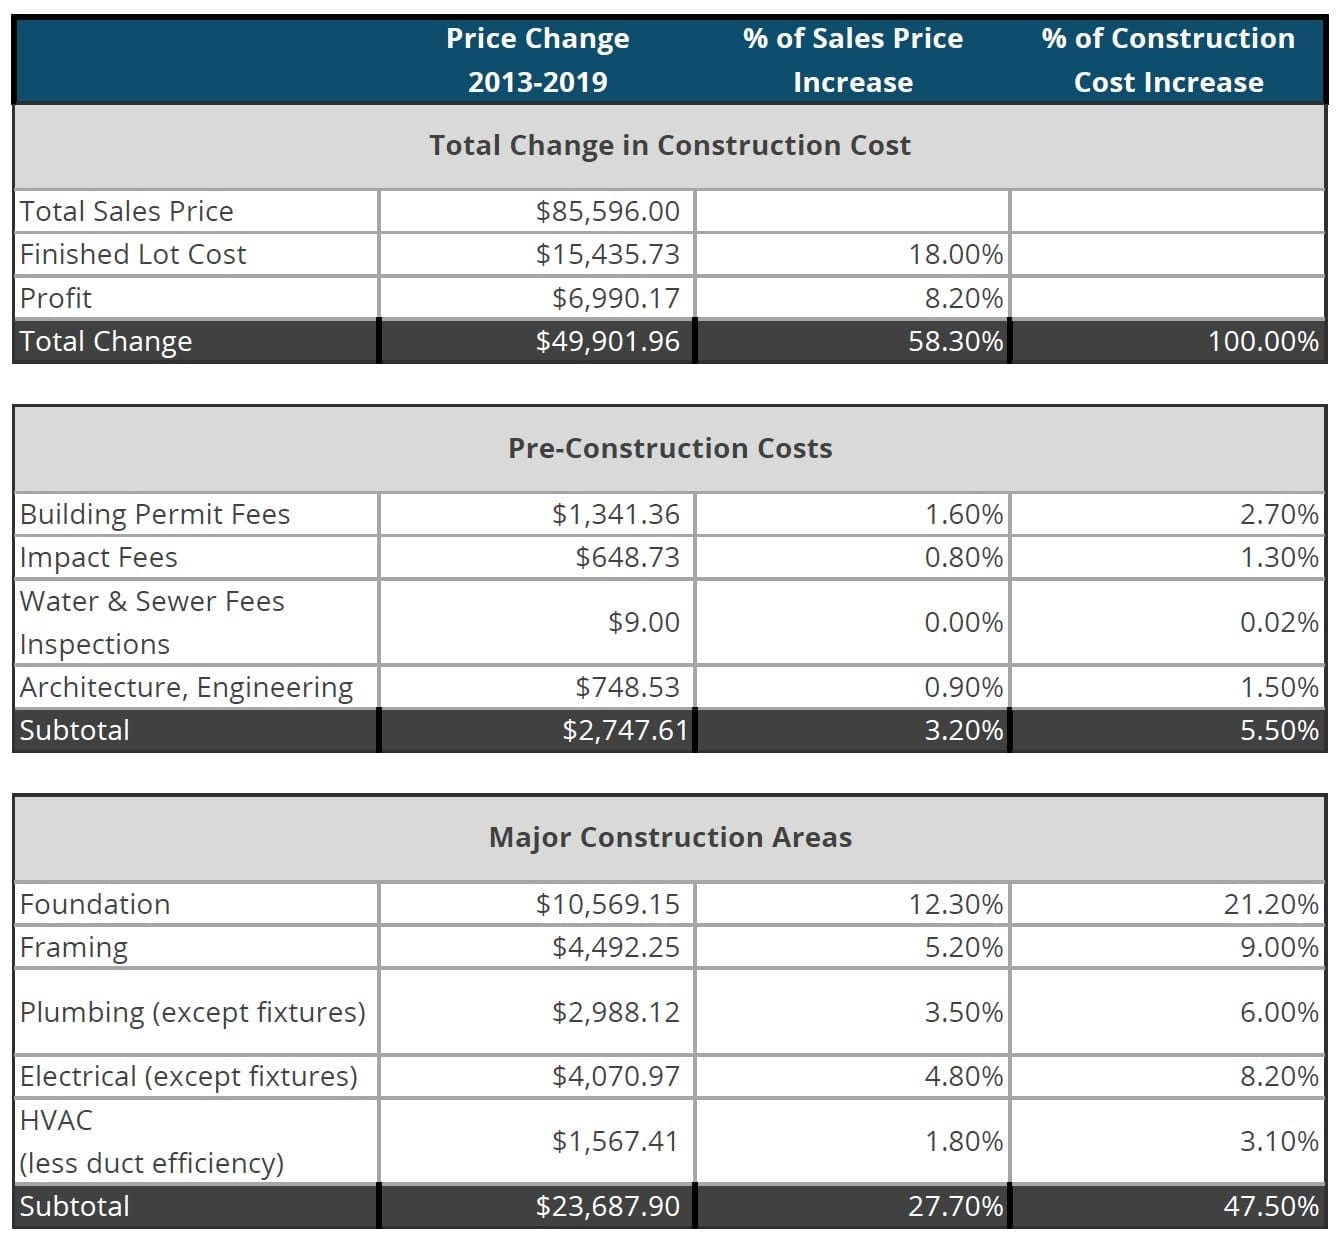
Of those increased construction costs, based on the assumptions above, we can see that the largest share of the increase is attributable to Major Construction Areas, at 47.5% of the rise in construction costs.
Next is Pre-Construction items at 5.5%.
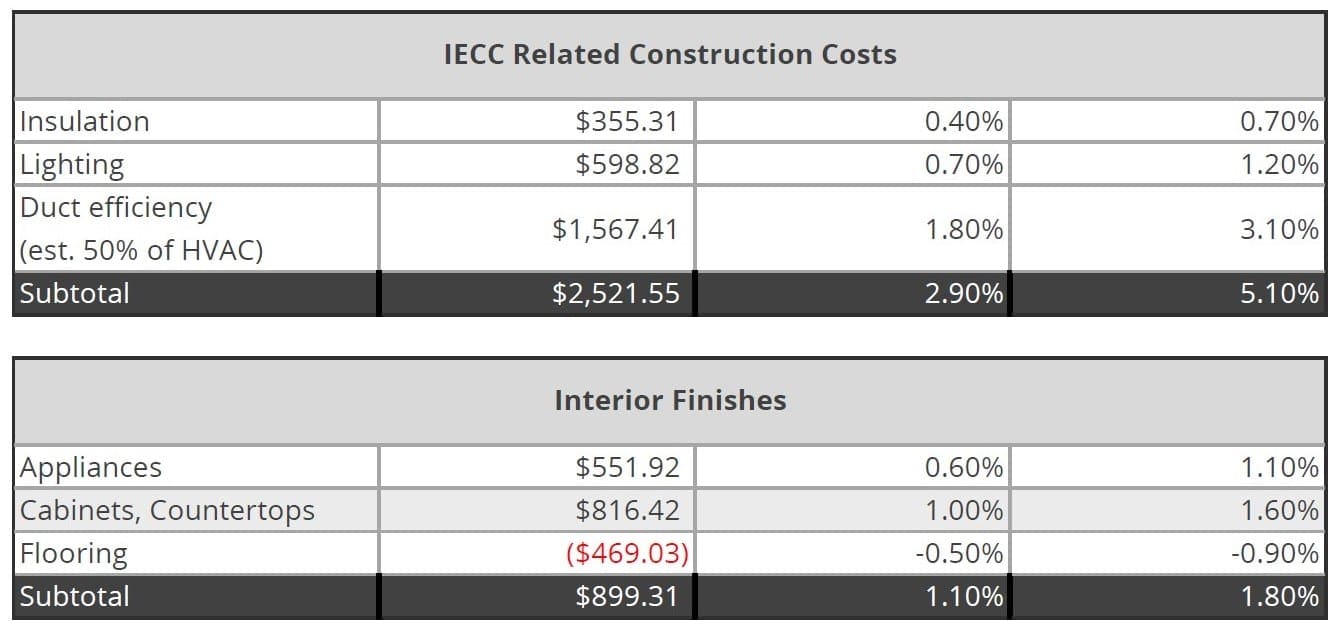
IECC related cost increases are 5.1% of the total increase in construction costs.


Breaking Down Rising Homebuilding Costs
ROI on IECC Related Costs
The dollar value total for increased IECC costs is $2,521.55.
Let's examine what that high cost means to the buyer of the home. While we are painting with a broad brush (different states and intra-state areas adopt at different times), at the time of the beginning of the dataset, 2013, we believe the 2009 IECC was the most likely adopted code. At the end of the dataset, in 2019, the most likely code to be in effect is the 2015 IECC.
According to the Building Codes Energy Program, after deration due to adoption and other factors, the efficiency gain from the 2009 code to the 2015 code is 25%. For reference sake, there was an 11% change from the 2006 code to the 2009, and the 2018 IECC is estimated to be a 5% reduction from the 2015. This study has valuable information relating to the overall impact of improving energy codes.
However, the results are aggregated, and drawing conclusions to an individual home is complex and beyond this piece. We expect to do further work on that topic in the future.
However, based on our assumptions from above:
- The efficiency improvement from the 2009 to the 2015 IECC is approximately 25%.
- The average home in 2019 had an annual electricity bill of $1380 (EIA), and the average natural gas bill was $712 (AGA) for a total of $2092
- A typical home in 2015 used 51% for heating and cooling (this percentage moves slowly but is moving slowly down as homes become more efficient)
- Our "typical" home has a heating and cooling bill of $1046 25% of $1046 is $261, so our simple payback on the $2521 of additional building cost is just under ten years
This example is fraught with assumptions and extrapolations. However, our point is that unlike virtually all other cost drivers pushing up the cost of constructing a home, there is a payback for investments in higher efficiency.
Additionally, and again, beyond our scope here, there are many intangible benefits from improved energy codes. These include the potential for improved indoor air quality, enhanced comfort dynamics, and improved durability. Of course, these potentials are all dependent on the quality of applying the code-driven changes.
Conclusion
Ready to explore the depth of data in Housing Tides?
Sign-up for a Housing Tides account to access the interface and dive into the data!
For a limited time only, we're offering complimentary access to Housing Tides. Don't miss out!