Housing supply reaches a new low as sales pick up with renewed economic activity.

Published July 30, 2020
Housing Supply Reaching New Lows
As I drive around my neighborhood the absence of homes for sale is surprising, no for sale signs grace any of the neatly trimmed lawns. The custom homebuilder across the street seems to be selling his $1.5 million homes as fast as he can build them. This is surprisingly happening in many parts of the country. If you are following the real estate market it is big news. There is a very low supply of homes.

Redfin data shown in Housing Tides demonstrates a multi-year low U.S. housing supply.
Overall U.S. housing inventory measured by months of supply at the current sales pace hit its lowest level since Redfin began reporting the data in 2012. The decline in the rate of home sales drove this measure of inventory up in May, but by June sales had rebounded, pushing the months of supply back down. This is clear when we examine local markets as well.
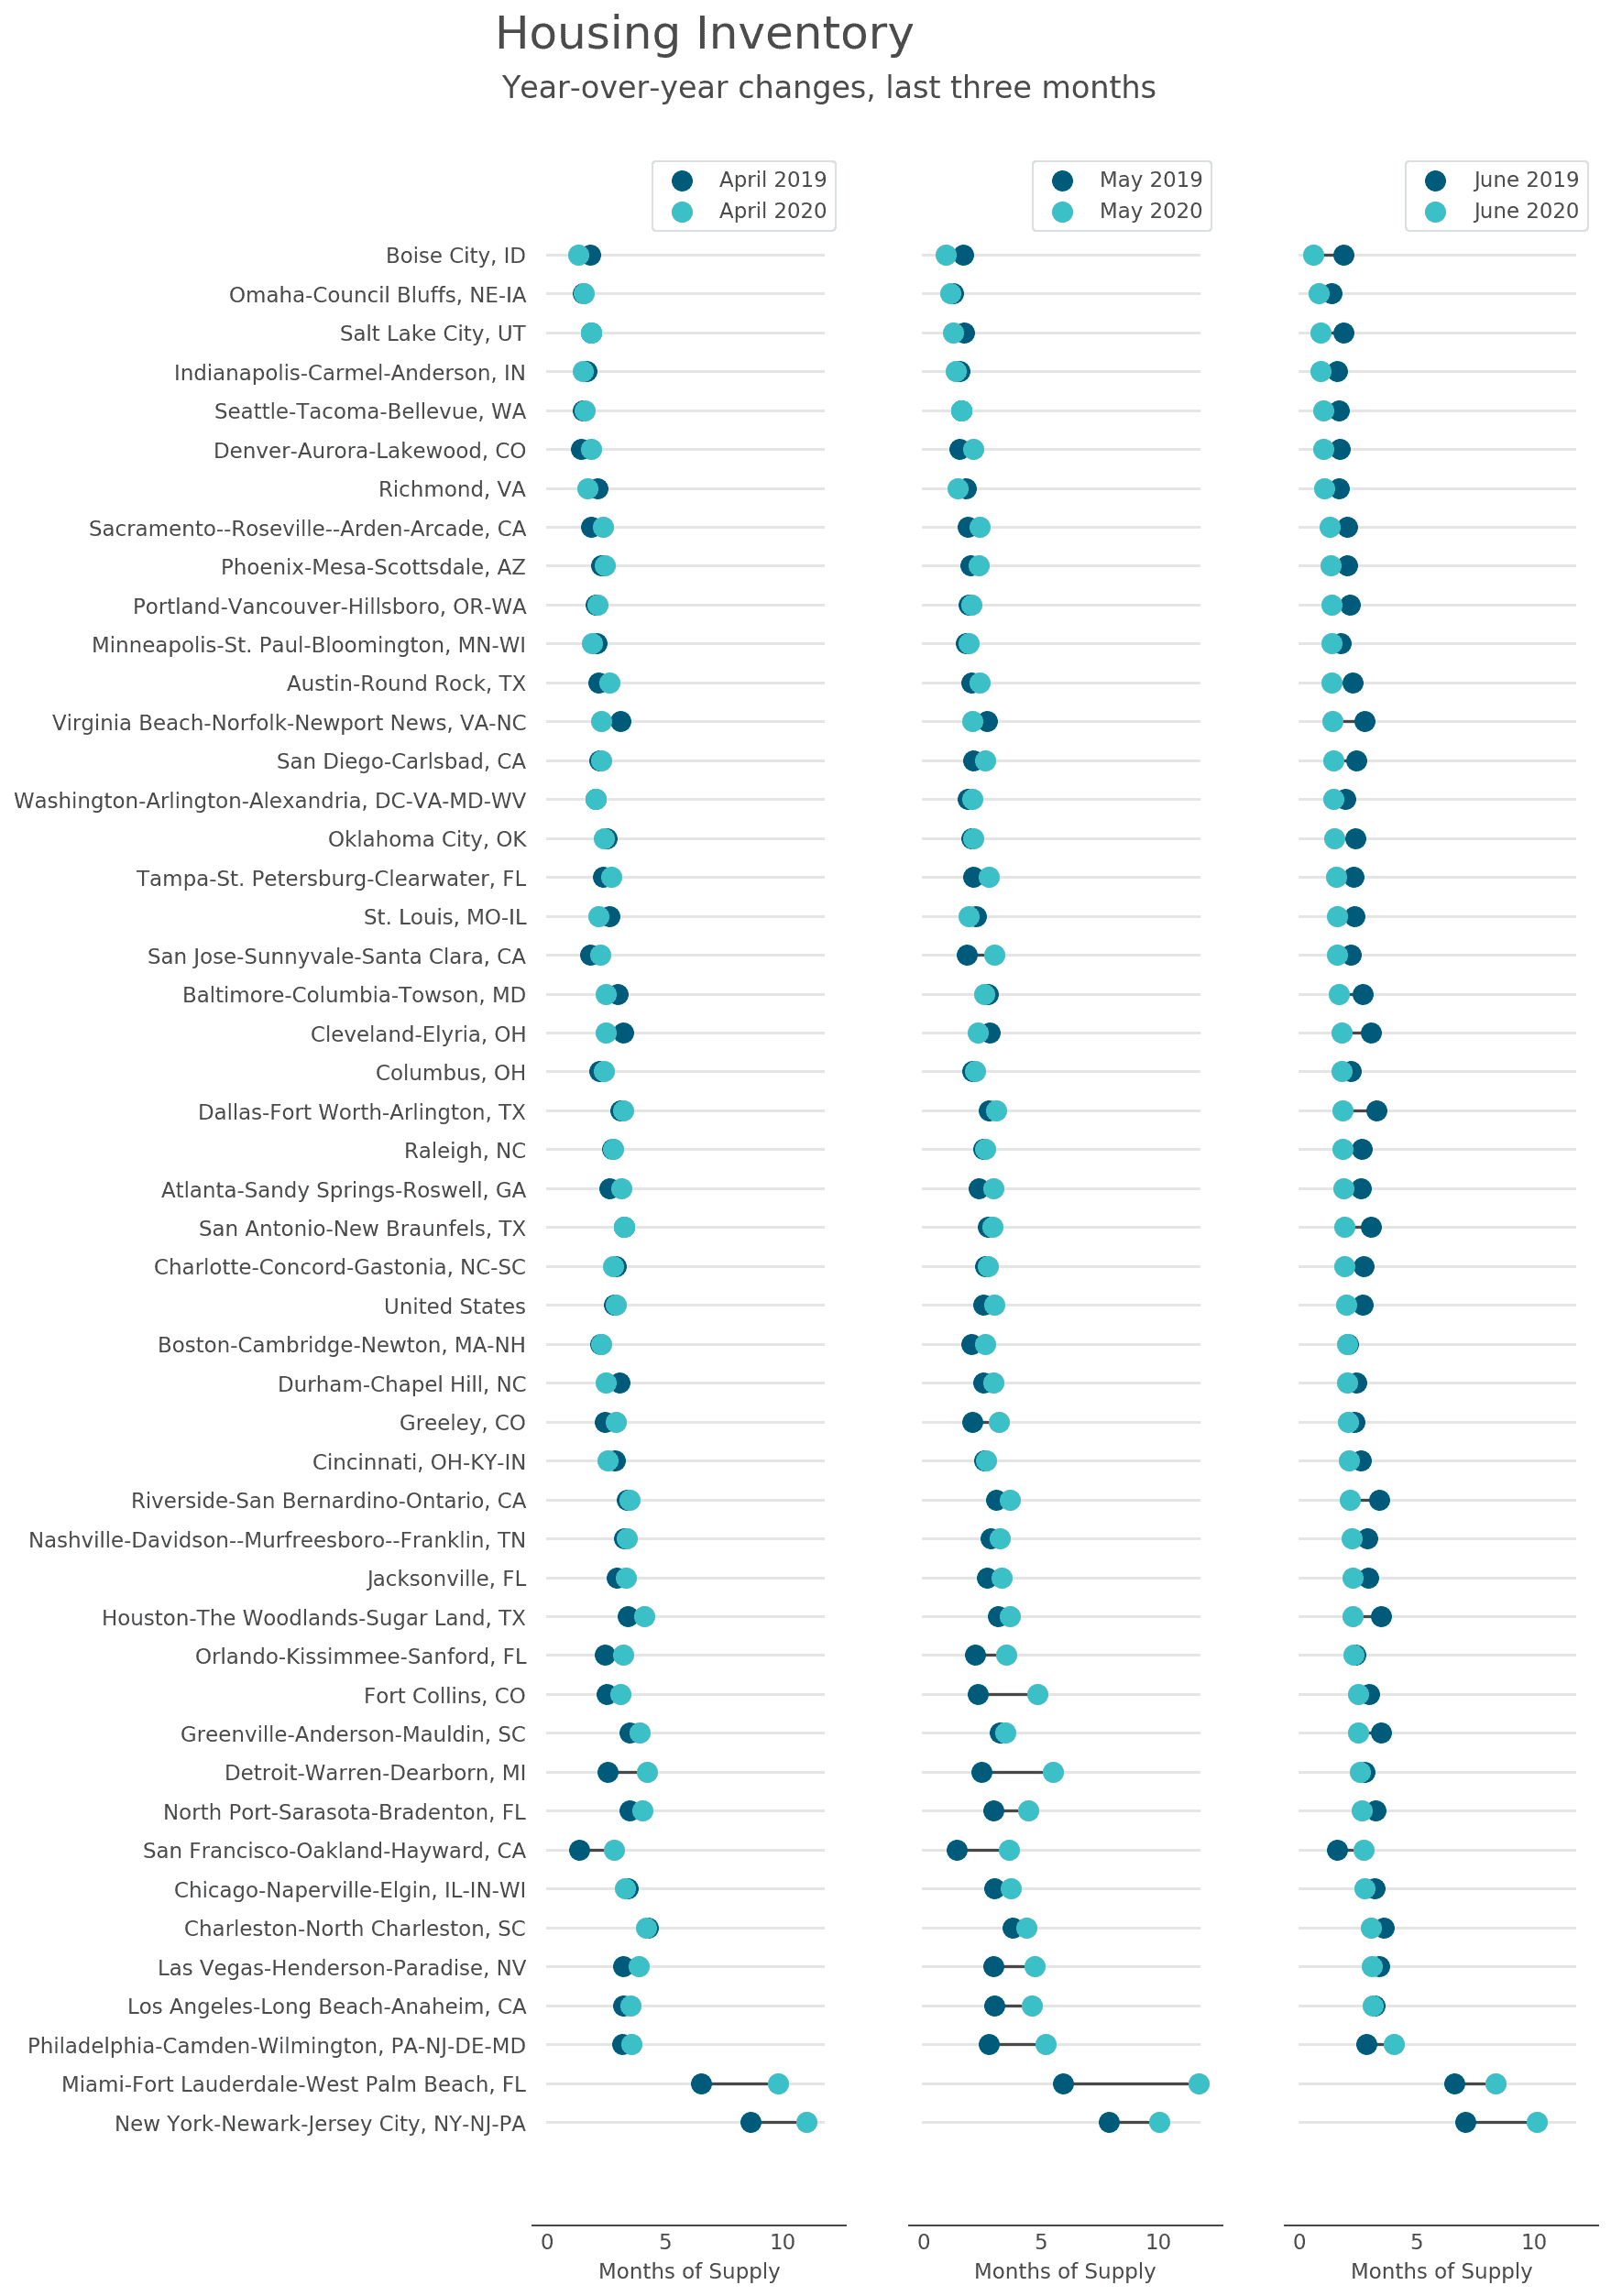
U.S. housing inventory data extracted from Housing Tides tells the story of year-over-year changes during the last three months.
How Many Homes Are in Forbearance?
There are manipulative forces at play affecting the housing market making it much better than it should be in a recession. A key force in keeping homes of the market are the mortgage forbearance programs that have been put into effect earlier in 2020. According to the Mortgage Bankers Association (MBA) as of July 27, the MBA estimates 3.9 million homeowners are in forbearance plans. This is 7.8% of mortgage servicers' portfolios.
Black Knight is an analytic firm that monitors the mortgage market conditions. In their latest Mortgage Monitor for May 2020 they estimate 4.7 million homes in forbearance. Black Knight economist Andy Walden estimates that 90% of homeowners in forbearance plans have at least 10% equity in their homes. This provides a cushion from the risk of foreclosure, giving the homeowner an opportunity to sellout without a loss.
COVID-19 forbearance plans were broadly set up under initial three-month terms with the CARES Act allowing for at least six months of forbearance with an extension to 12 months upon borrower request for those in government-backed loans.
Unintended Consequences
A homeowner that is in forbearance has no incentive to put that home on the market because the mortgage payment is deferred. With few job opportunities as many jobs disappeared there is no opportunity to relocate. The low supply of homes is an unintended consequence of the mortgage forbearance program.
The market has never before seen these forbearance programs before. Even during the Great Recession these programs were unknown. We are experiencing the secondary impacts and their consequences. Quite possibly, a serendipitous moment for homebuilders and solvent homeowners will occur as demand exceeds supply and prices rise.
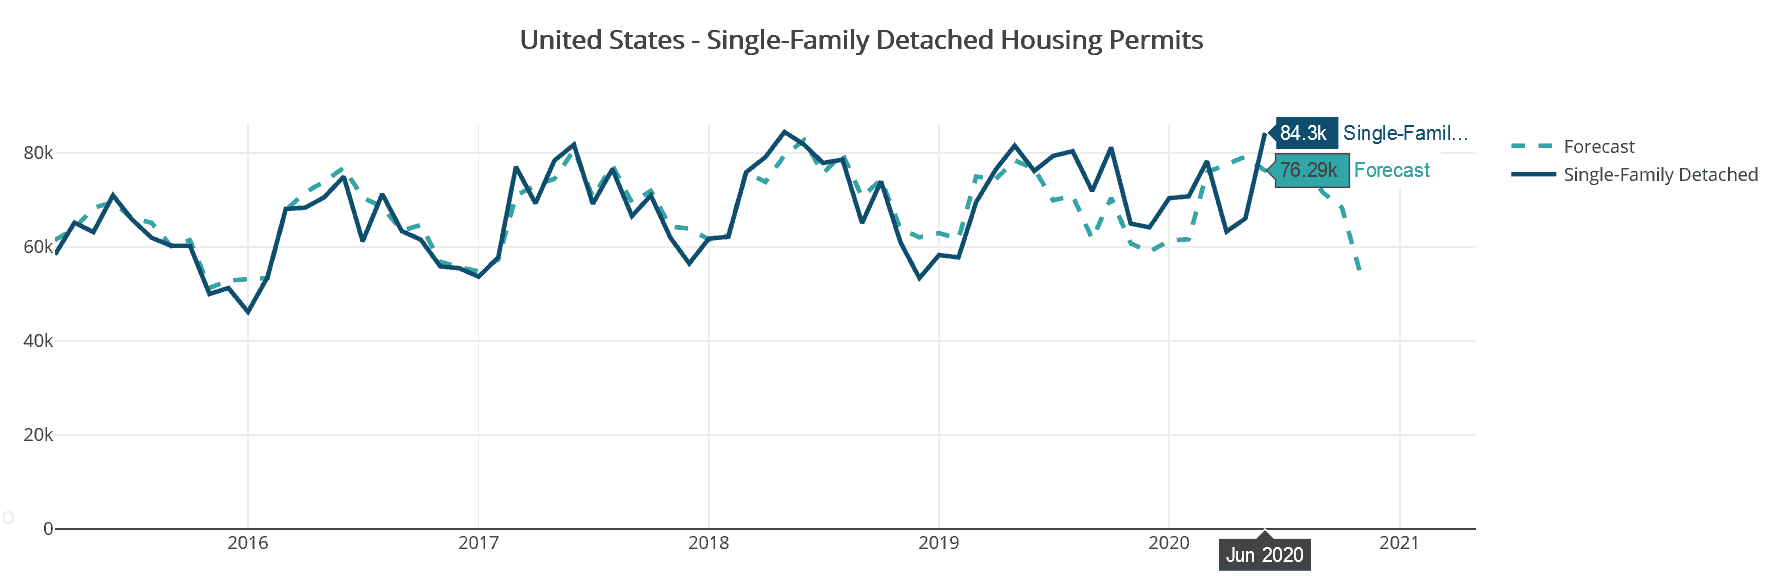
Housing Tides data show U.S. single-family housing permits reach highest level since May 2018.
If you are a homeowner or a homebuilder this will be a euphoric sweet spot in the market for you. Be prepared, it is bound to come to an end. Don’t expect this lack of for sale signs to continue.
When the forbearance programs phase out and these nearly 4 million homeowners have to write mortgage loan checks again every month, a flood of supply will hit the markets as the number of listings moves toward equilibrium.
Use Housing Tides™ to Adjust to Changing Market Conditions
Once again when we see the effects of forbearance programs end, the dynamics of the real estate market will change. Subscribe to Housing Tides interactive interface to monitor market research and trends.


Ready to explore the depth of data in Housing Tides?
Sign-up for a Housing Tides account to access the interface and dive into the data!
For a limited time only, we're offering complimentary access to Housing Tides. Don't miss out!

About Jeff Whiton
Jeff formerly headed operations for Lennar and KB Home in Colorado building nearly two per cent of the state’s total single-family housing stock. He was honored as Colorado’s Home Builder of the Year in 2001. Whiton also served as the CEO of the Home Builders Association of Metro Denver for eight years reviving the association from near bankruptcy after the Great Recession.
One Comment on “Where Are the For Sale Signs?”
Hi Jeff Great subject and timely charts. THANKS. I live in Westminster CO and I am the USA S.W. rep for http://www.phius.org (Passive House Building Code). For the past 5 years, I have been giving monthly presentations to architects, builders and the public from AZ to UT to CO. I would love for you to give my group a presentation on this subject, – Status of the home industry during COVID times.
Are you available to give a one hour presentation at noon, Mountain time on Sept 01? It would be by webinar. Please let me know.
Thanks John E Avenson M 425-495-5990 9988 Hoyt Pl Westminster CO 80021