The pandemic is now - the effects on housing may not evenly be distributed.*

Published July 7, 2020
Looking for Housing Market Clues
EnergyLogic’s CEO, Steve Byers, offered an interesting insight this week. He noted that, while many are claiming a V-shaped housing market recovery, we should look more closely at the geographic trends of COVID-19 cases in the country to get a better picture of the effects on housing markets in coming months.
Housing Leading a Strong Recovery
Thus far in this pandemic, housing has held up well. Weekly U.S. pending home sales have rebounded substantially and are now only down 6.5% year-over-year.
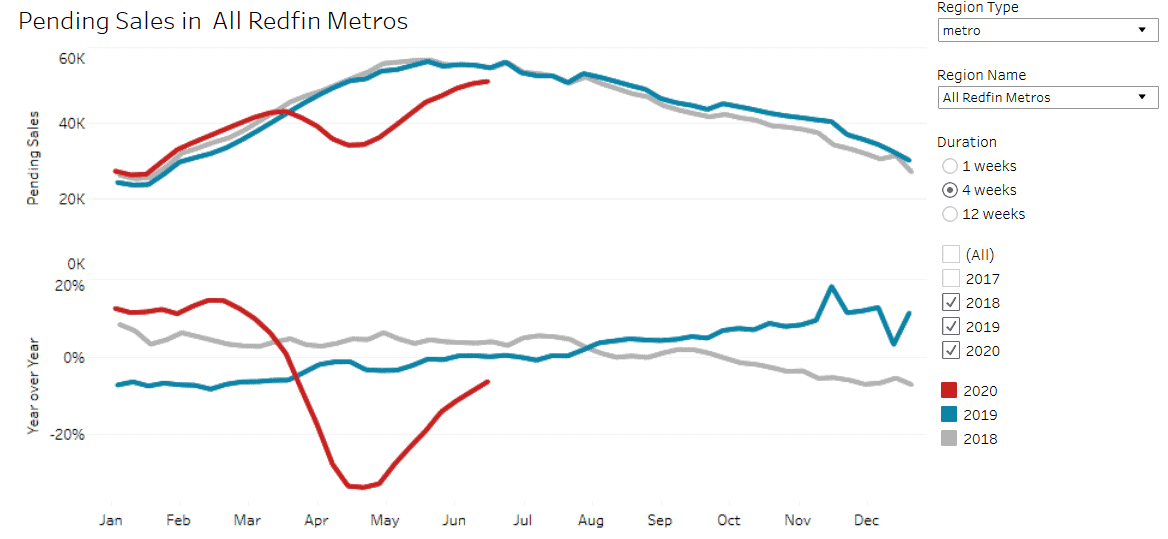
Click to expand image. Source: Redfin
Expectations among homebuilders have regained ground too, with the NAHB/Wells Fargo Housing Market Index survey of builders at 58 in June, positive again after falling below the neutral value of 50 in April and May. Public expectations are high as well, with the iShares U.S. Home Construction ETF (ITB) index of public homebuilder stocks up 79.5% from its closing low of $24.14 on in late March. Neither index has returned all the way to peak levels from the recent months, but we can still see strong signals of positive sentiment.

Click to expand image. Source: Yahoo! Finance
However, the way various parts of the country have been differently affected by COVID-19 – with New York, New Jersey, and Massachusetts enduring the worst outbreaks as measured by total positive cases per 100k people through April – suggests that the effects on housing will be more challenging in the second half of 2020. Below I’ve plotted this measure of COVID-19 cases on the left y-axis, and the percentage of tests which returned positive on the right y-axis. 2019 construction permits are on the x-axes and estimated 2019 population is represented by the size of each bubble.
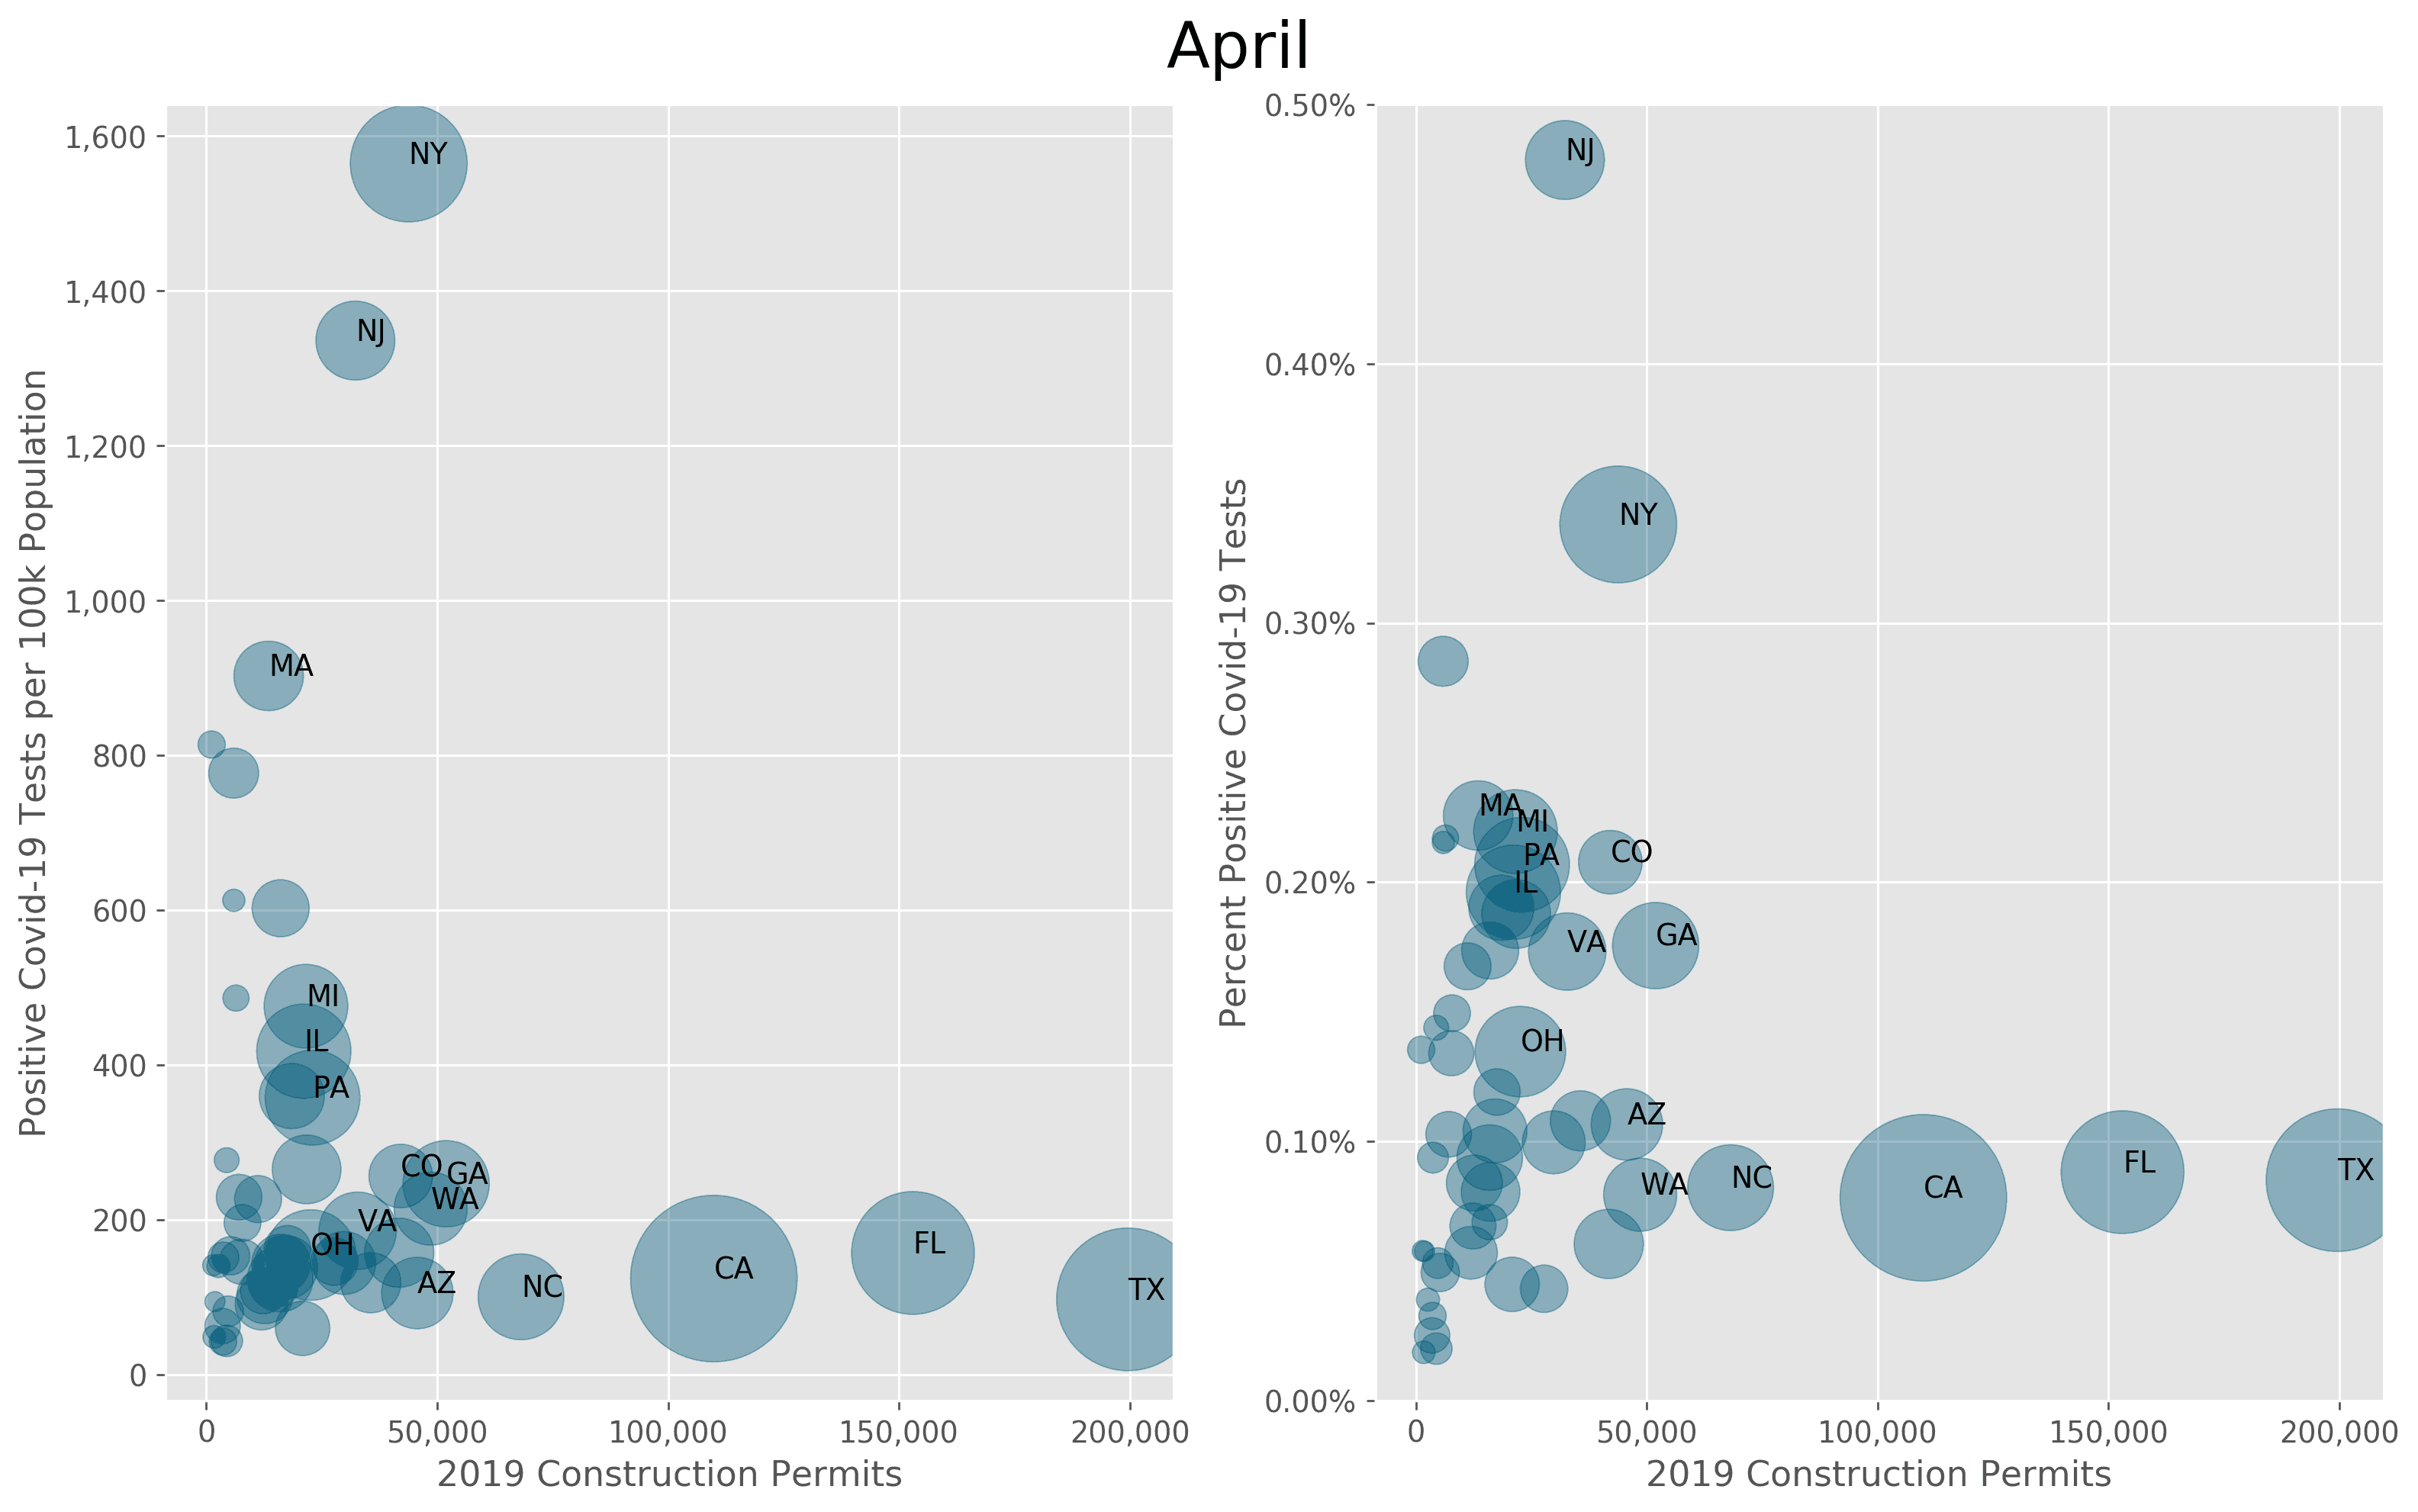
Click to expand image. Source: The COVID Tracking Project, U.S. Census Bureau
Sun Belt Disruption
You’ll see that in April, excepting New York, the states with the largest outbreaks were not among those with the most construction, nor are they the most populous. The five states with the worst outbreaks are in the Northeast, which had 50k fewer housing units permitted in 2019 than the next Census region, the Midwest. Contrast this with the nation’s three most populous states, California, Texas, and Florida, which at this point had relatively tame outbreaks by these measures. These states are in the South and the West regions, which contributed over 75% of the total homes permitted in 2019.
Through June, wider testing availability has brought the share of tests returning positive down considerably in most states. New York and New Jersey still have the most cumulative cases, but COVID-19 is surging in the heavily populated Sun Belt states, jeopardizing economic and homebuilding activity.
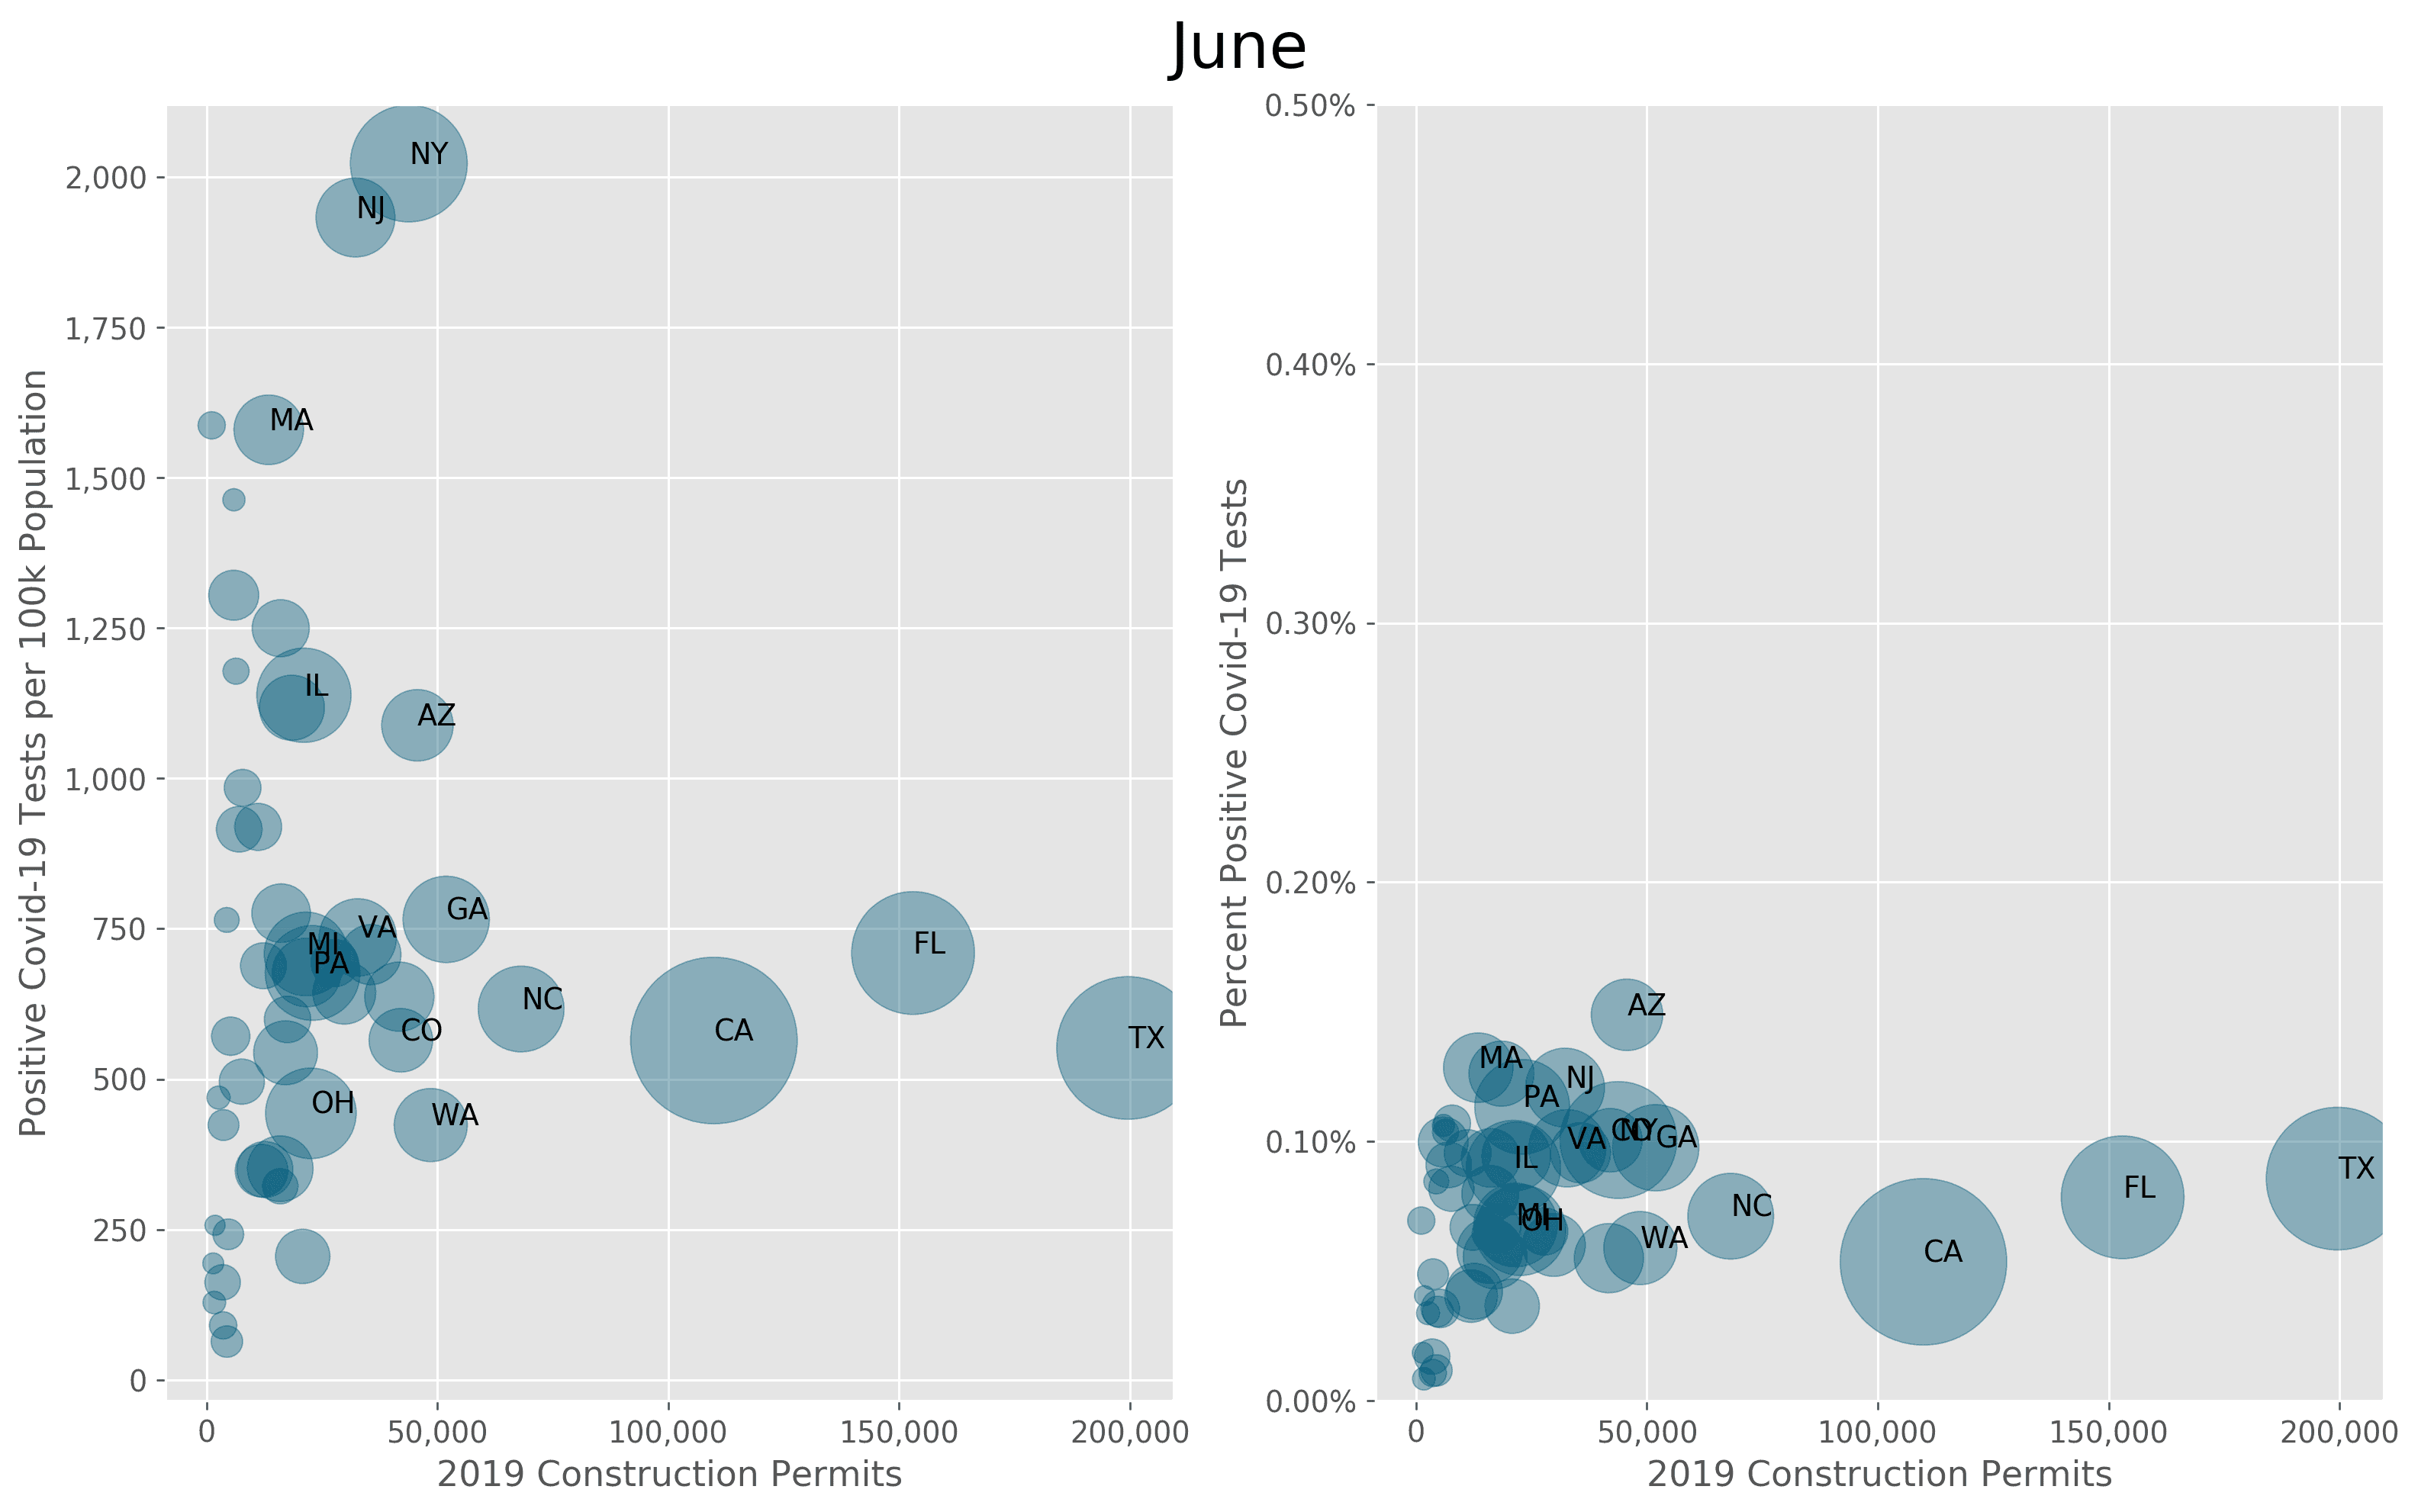
Click to expand image. Source: The COVID Tracking Project, U.S. Census Bureau
Disruption Likely to Persist
This isn’t to say that COVID-19 is the death knell for U.S. housing markets. The average age of those testing positive has fallen, suggesting lower mortality, and stay-at-home orders bought health care providers time to prepare and stock supplies. Still, recognizing that the disease is still in its early stages of spreading to the places that make up the bulk of U.S. home construction means that we should expect further disruption to construction schedules and homebuyer demand in the months ahead.
* Adapted from William Gibson's original quote "The future is already here - it's just not evenly distributed."


Ready to explore the depth of data in Housing Tides?
Sign-up for a Housing Tides account to access the interface and dive into the data!
For a limited time only, we're offering complimentary access to Housing Tides. Don't miss out!